Timeline
- Spring 2016 (Siphon on; stable isotope data collection)
- Spring 2018 (Siphon off; field collections)
- Spring 2019 (Siphon off; field collections)
- Spring 2020 (Siphon off; no collections)
- Spring 2021 (Siphon on; anticipated field collections)
Summary Findings
Simarilities between created sites (LHA & LHB)
and reference sites (LHC & WPH2)

Insights from the last time the siphon was on in 2016
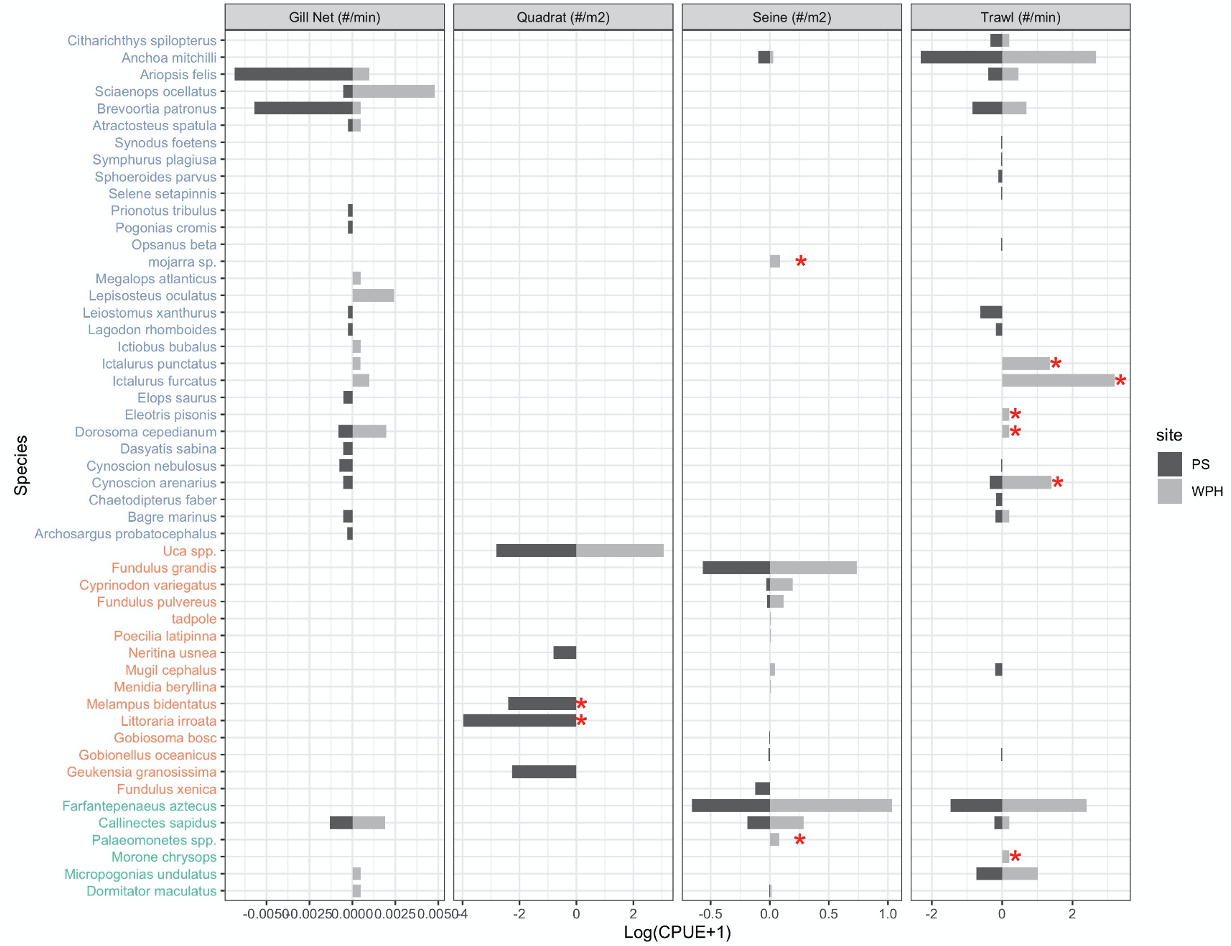
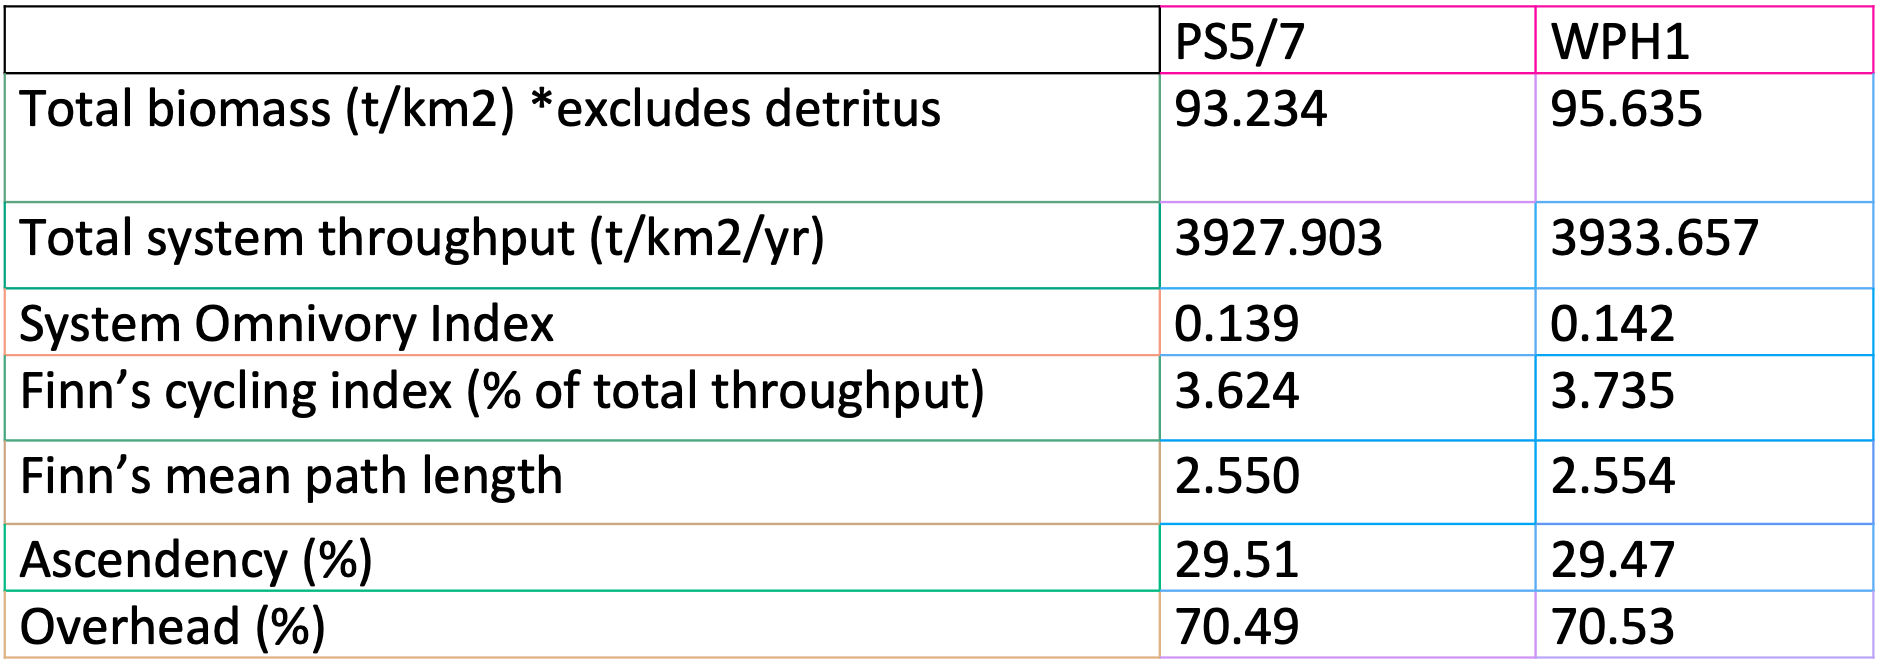 Ecopath modeling indicates that food web structure and ecosystem properties were similar between sites with different salinity regimes.
Insights from the last time the siphon was on in 2016
 (Click to Enlarge)
Hydrology and Elevation Mapping
(Swenson/Polito)
Key Findings
- Correlation among sites is high for all parameters, temperature, conductivity and marsh water level.
- Most (70%) of the differences between the 2019 and 2018 elevation surveys were fairly small (<5 cm) with 74% of the 2019 elevations being higher
- The percentage of the day that a marsh is flooded is correlated with the daily mean water level for CRMS3680.
- The percent marsh flooding can be calculated from measured water level (in m NAVD88) using a logistic sigmoid growth model.
(Note: CRMS3680 is the index station)


Key Findings
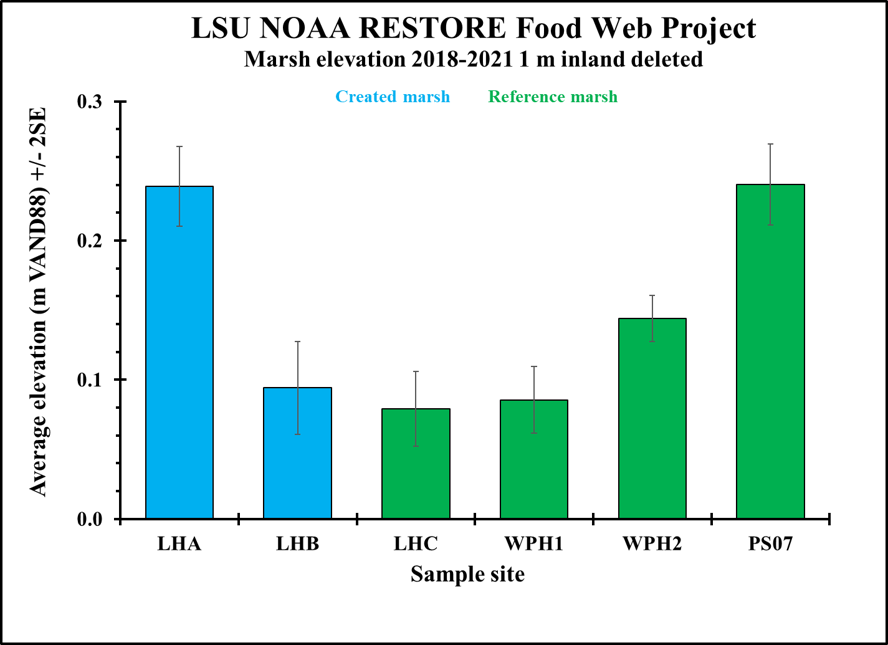
 Marsh elevation
- LHA has the highest elevation (18.4 cm), the other sites are all similar (6.8-10 cm)
- Reference marshes have a more uniform marsh surface (lower SE) compared to the created marshes.
Flooding duration
- LHA is flooded the least (7.9 hrs d-1), the other sites are similar (12.1-13.5 hrs d-1).
- Reference marshes have more uniform flooding across the landscape (lower SE) compared to the created marshes.
Hydroperiod Analysis
LSU, CRMS, USGS, NOS stations
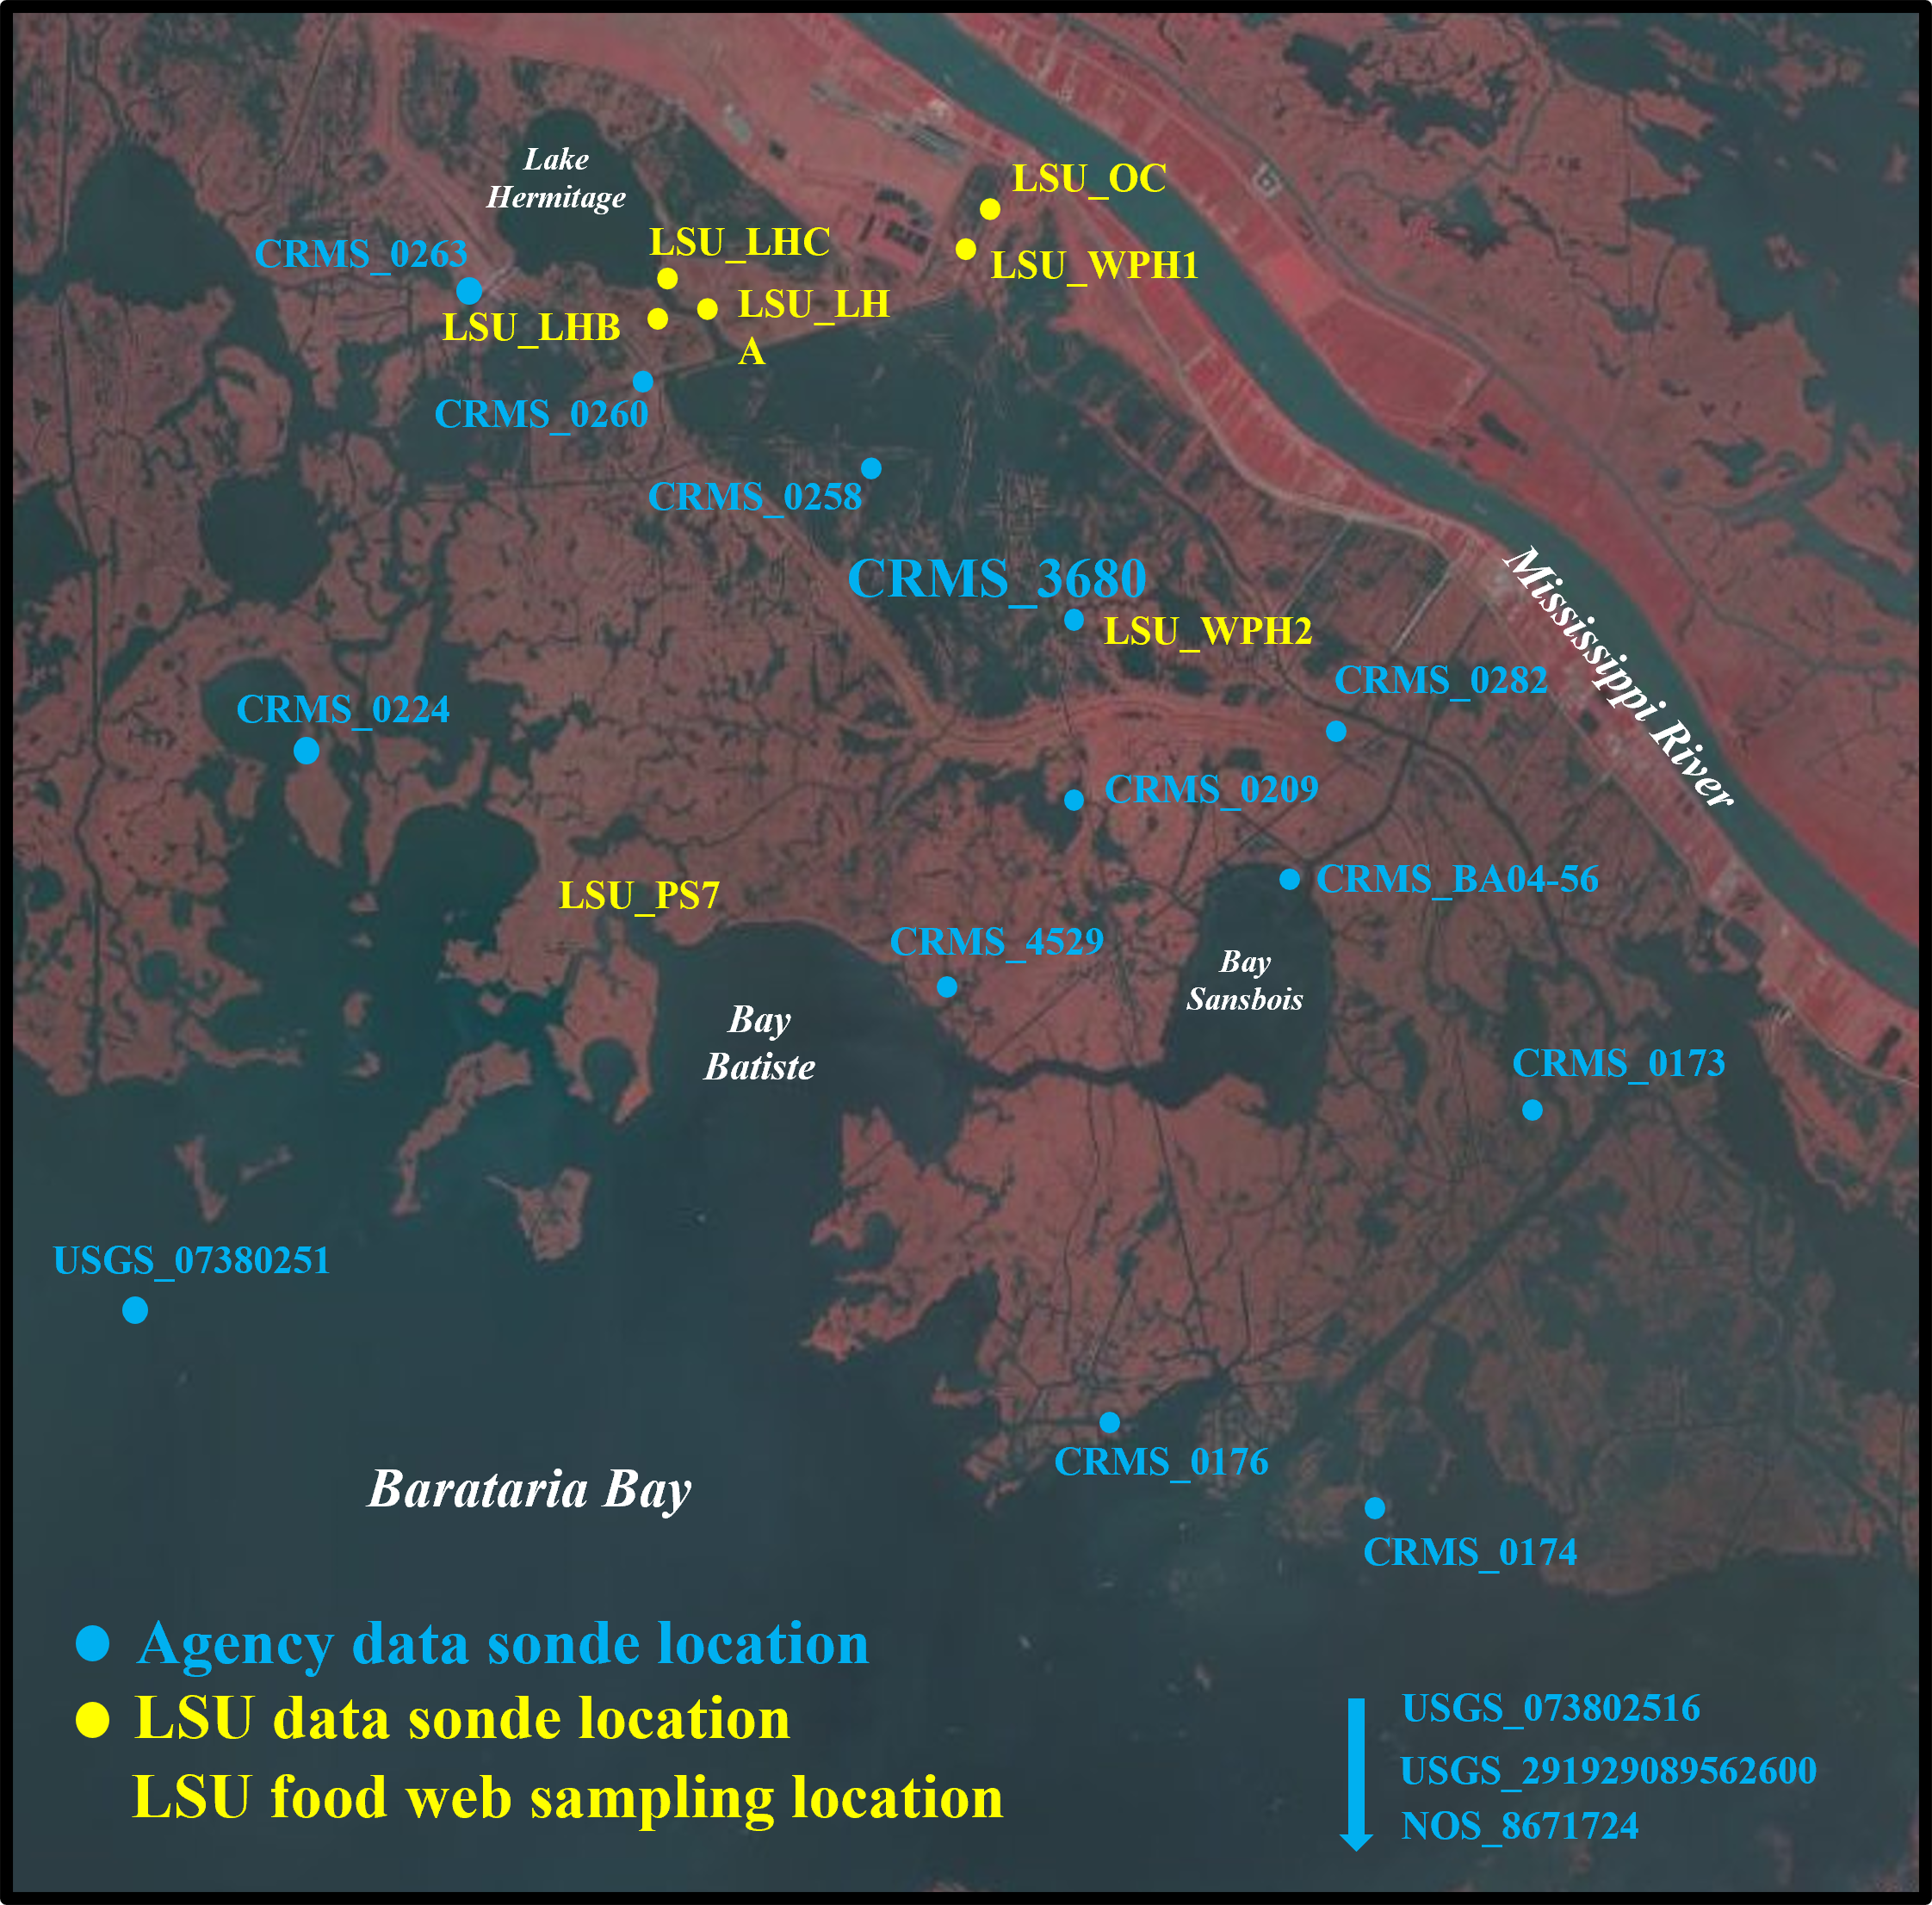
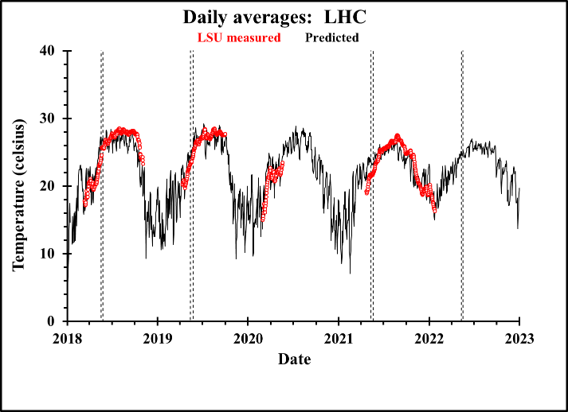
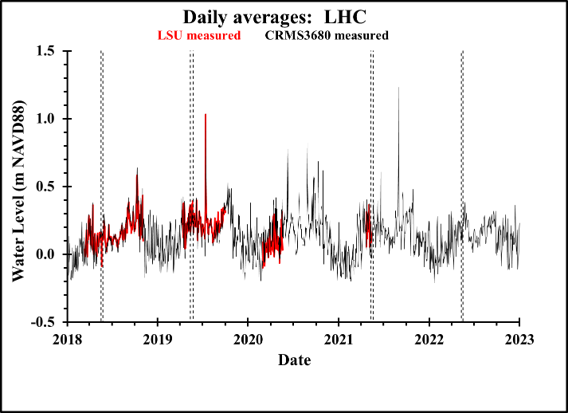
- The correlations among the CRMS and USGS stations was high for water temperature (>0.9 for all data), salinity (>0.9 for 70% of the stations and water level (>0.9 for 78% of the stations). CRMS3680 was selected as an index station for LHA, LHB, LHC, WPH1, WPH2. The LSU sondes were used to develop the relation between the LSU gage and CRMS3680 for each LSU data sonde location. This allowed for a complete data set since the LSU sondes did not operate continuously over the entire time period. In the case of PS7 CRMS4529 was used to represent conditions at that site.
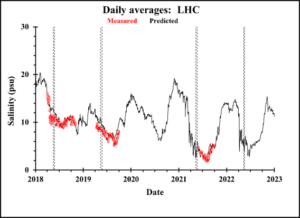
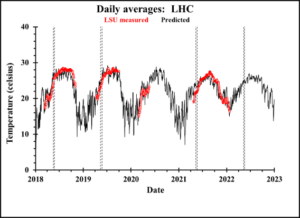
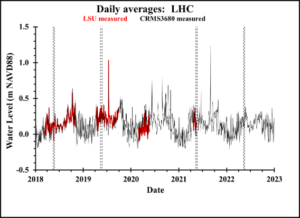
- Example of daily average predicted (from CRMS3680) salinity (left panel) and water temperature (middle panel) at LHC. The right panel presents measured water levels from CRMS3680 and the LSU data sonde. The dashed vertical lines indicate the dates of the LSU field sampling trips.

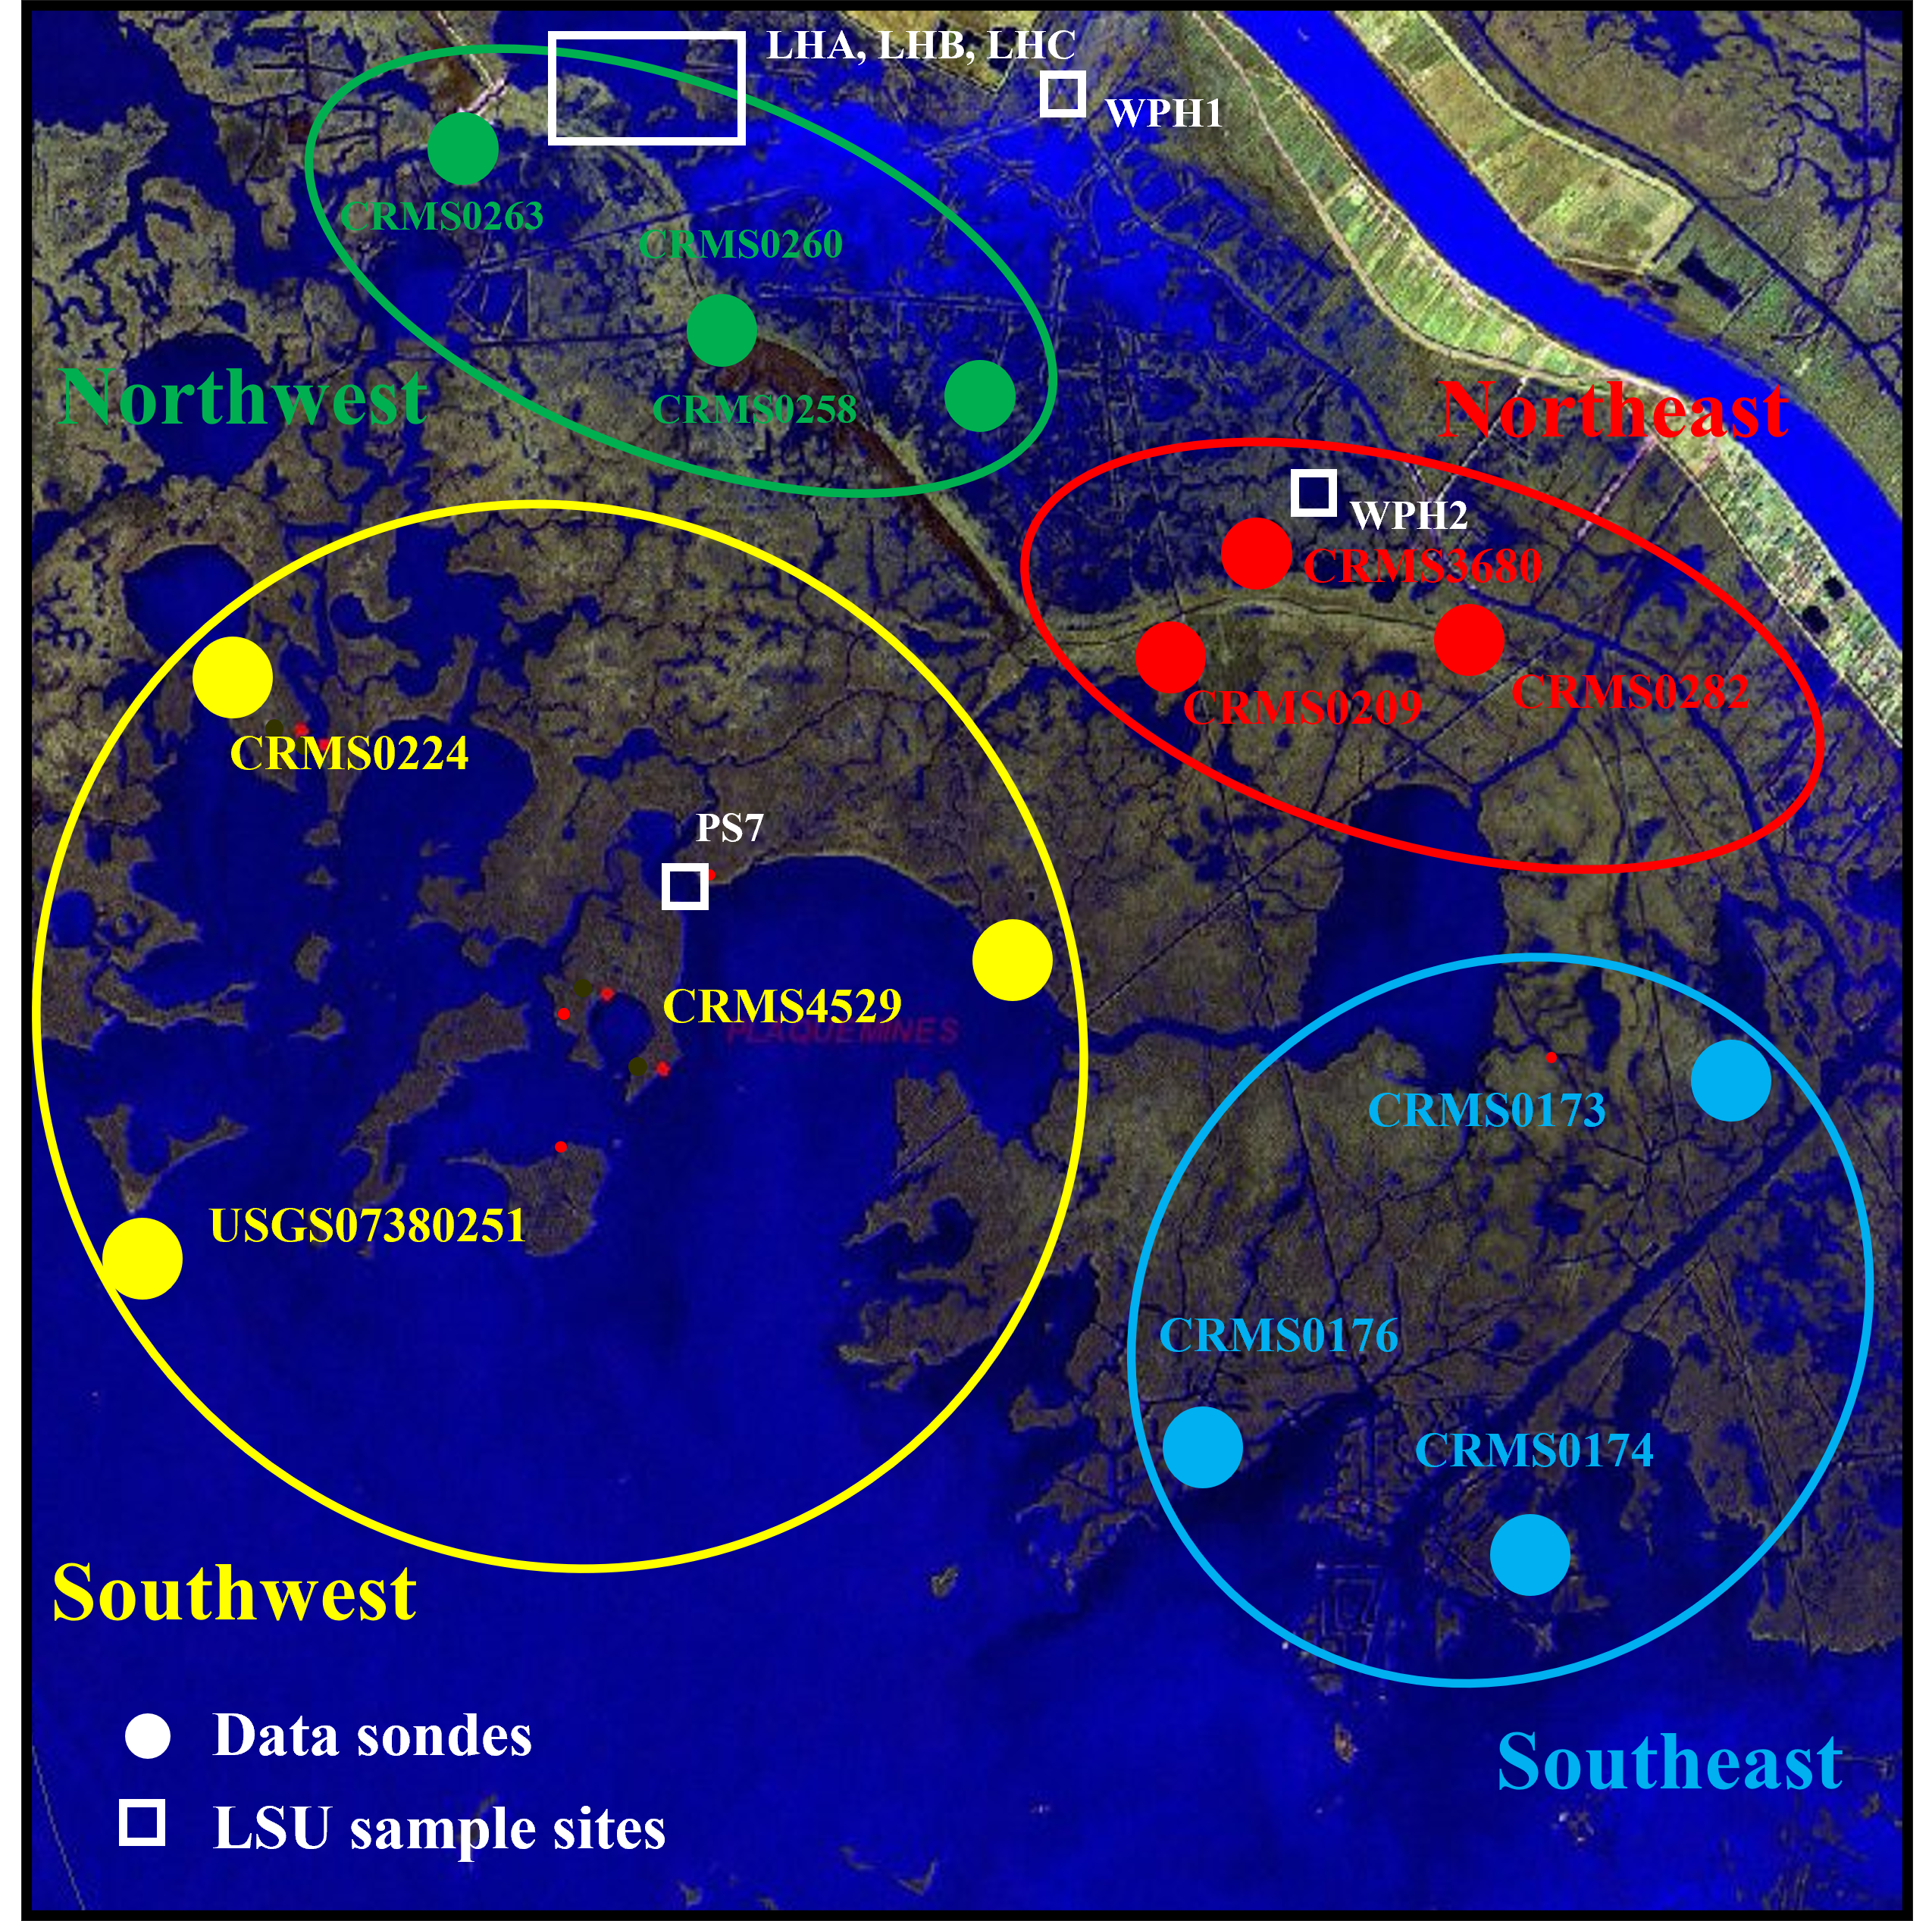
Stations were grouped by regions for study area characterization
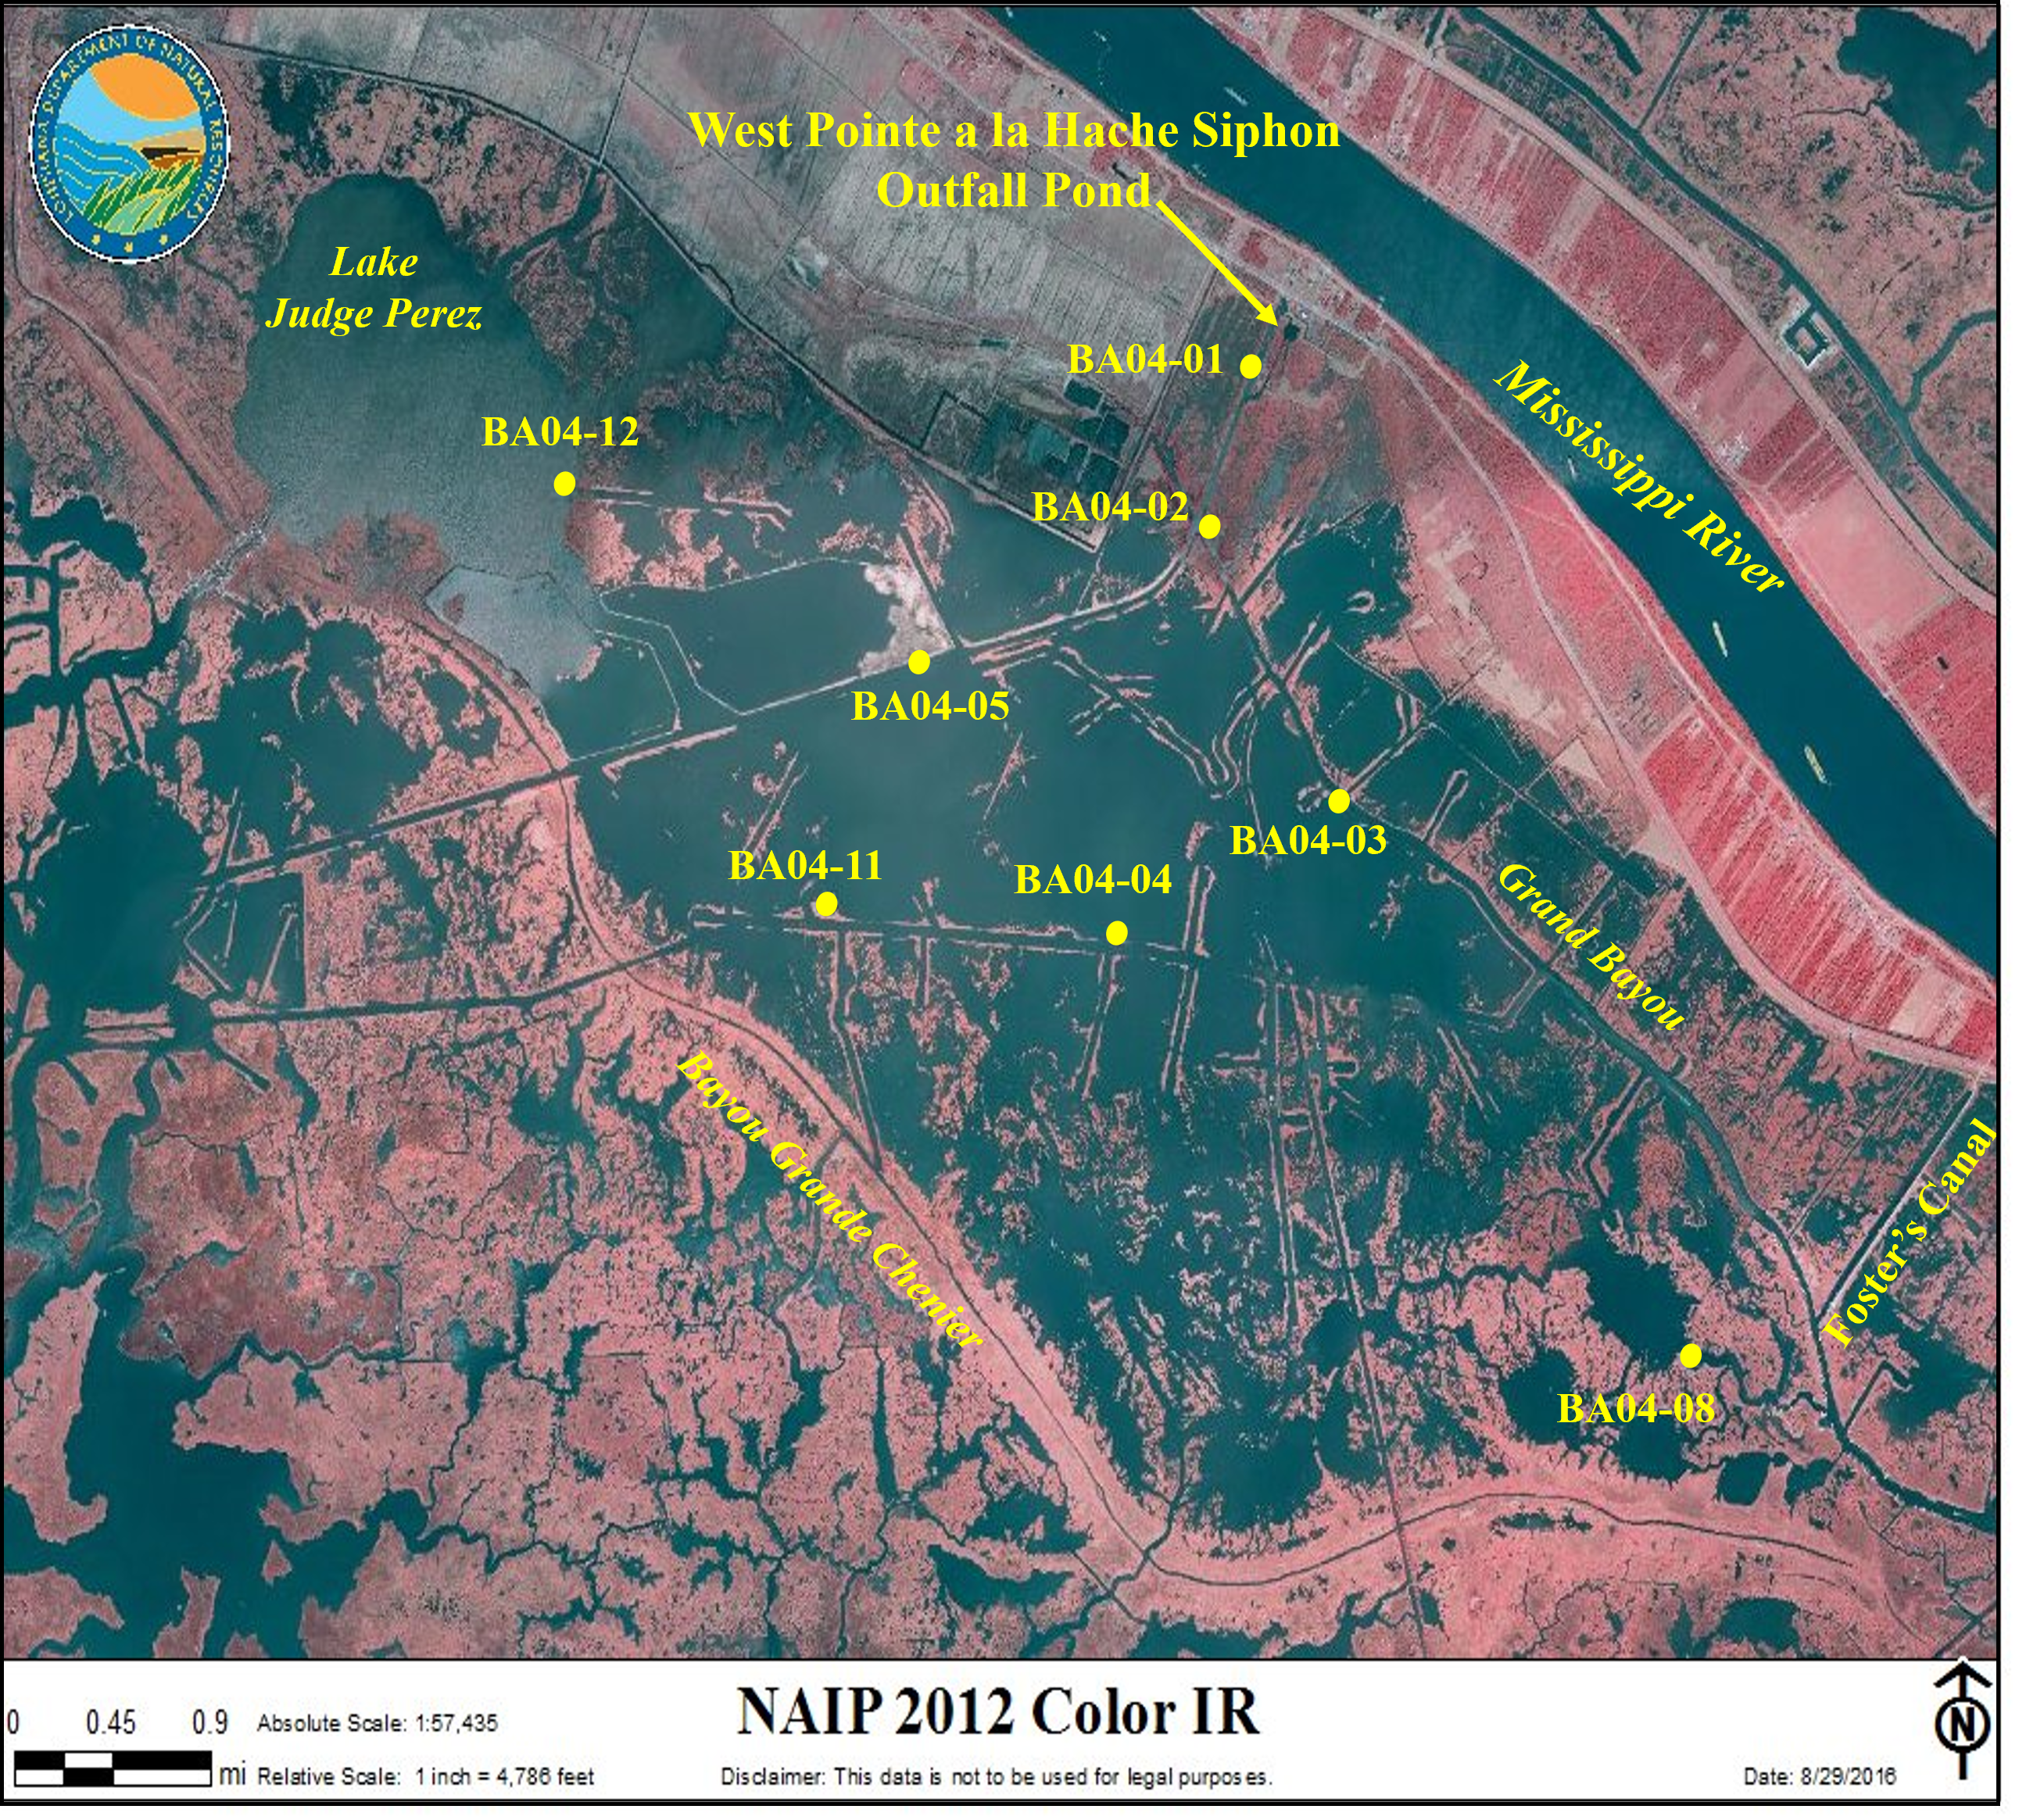
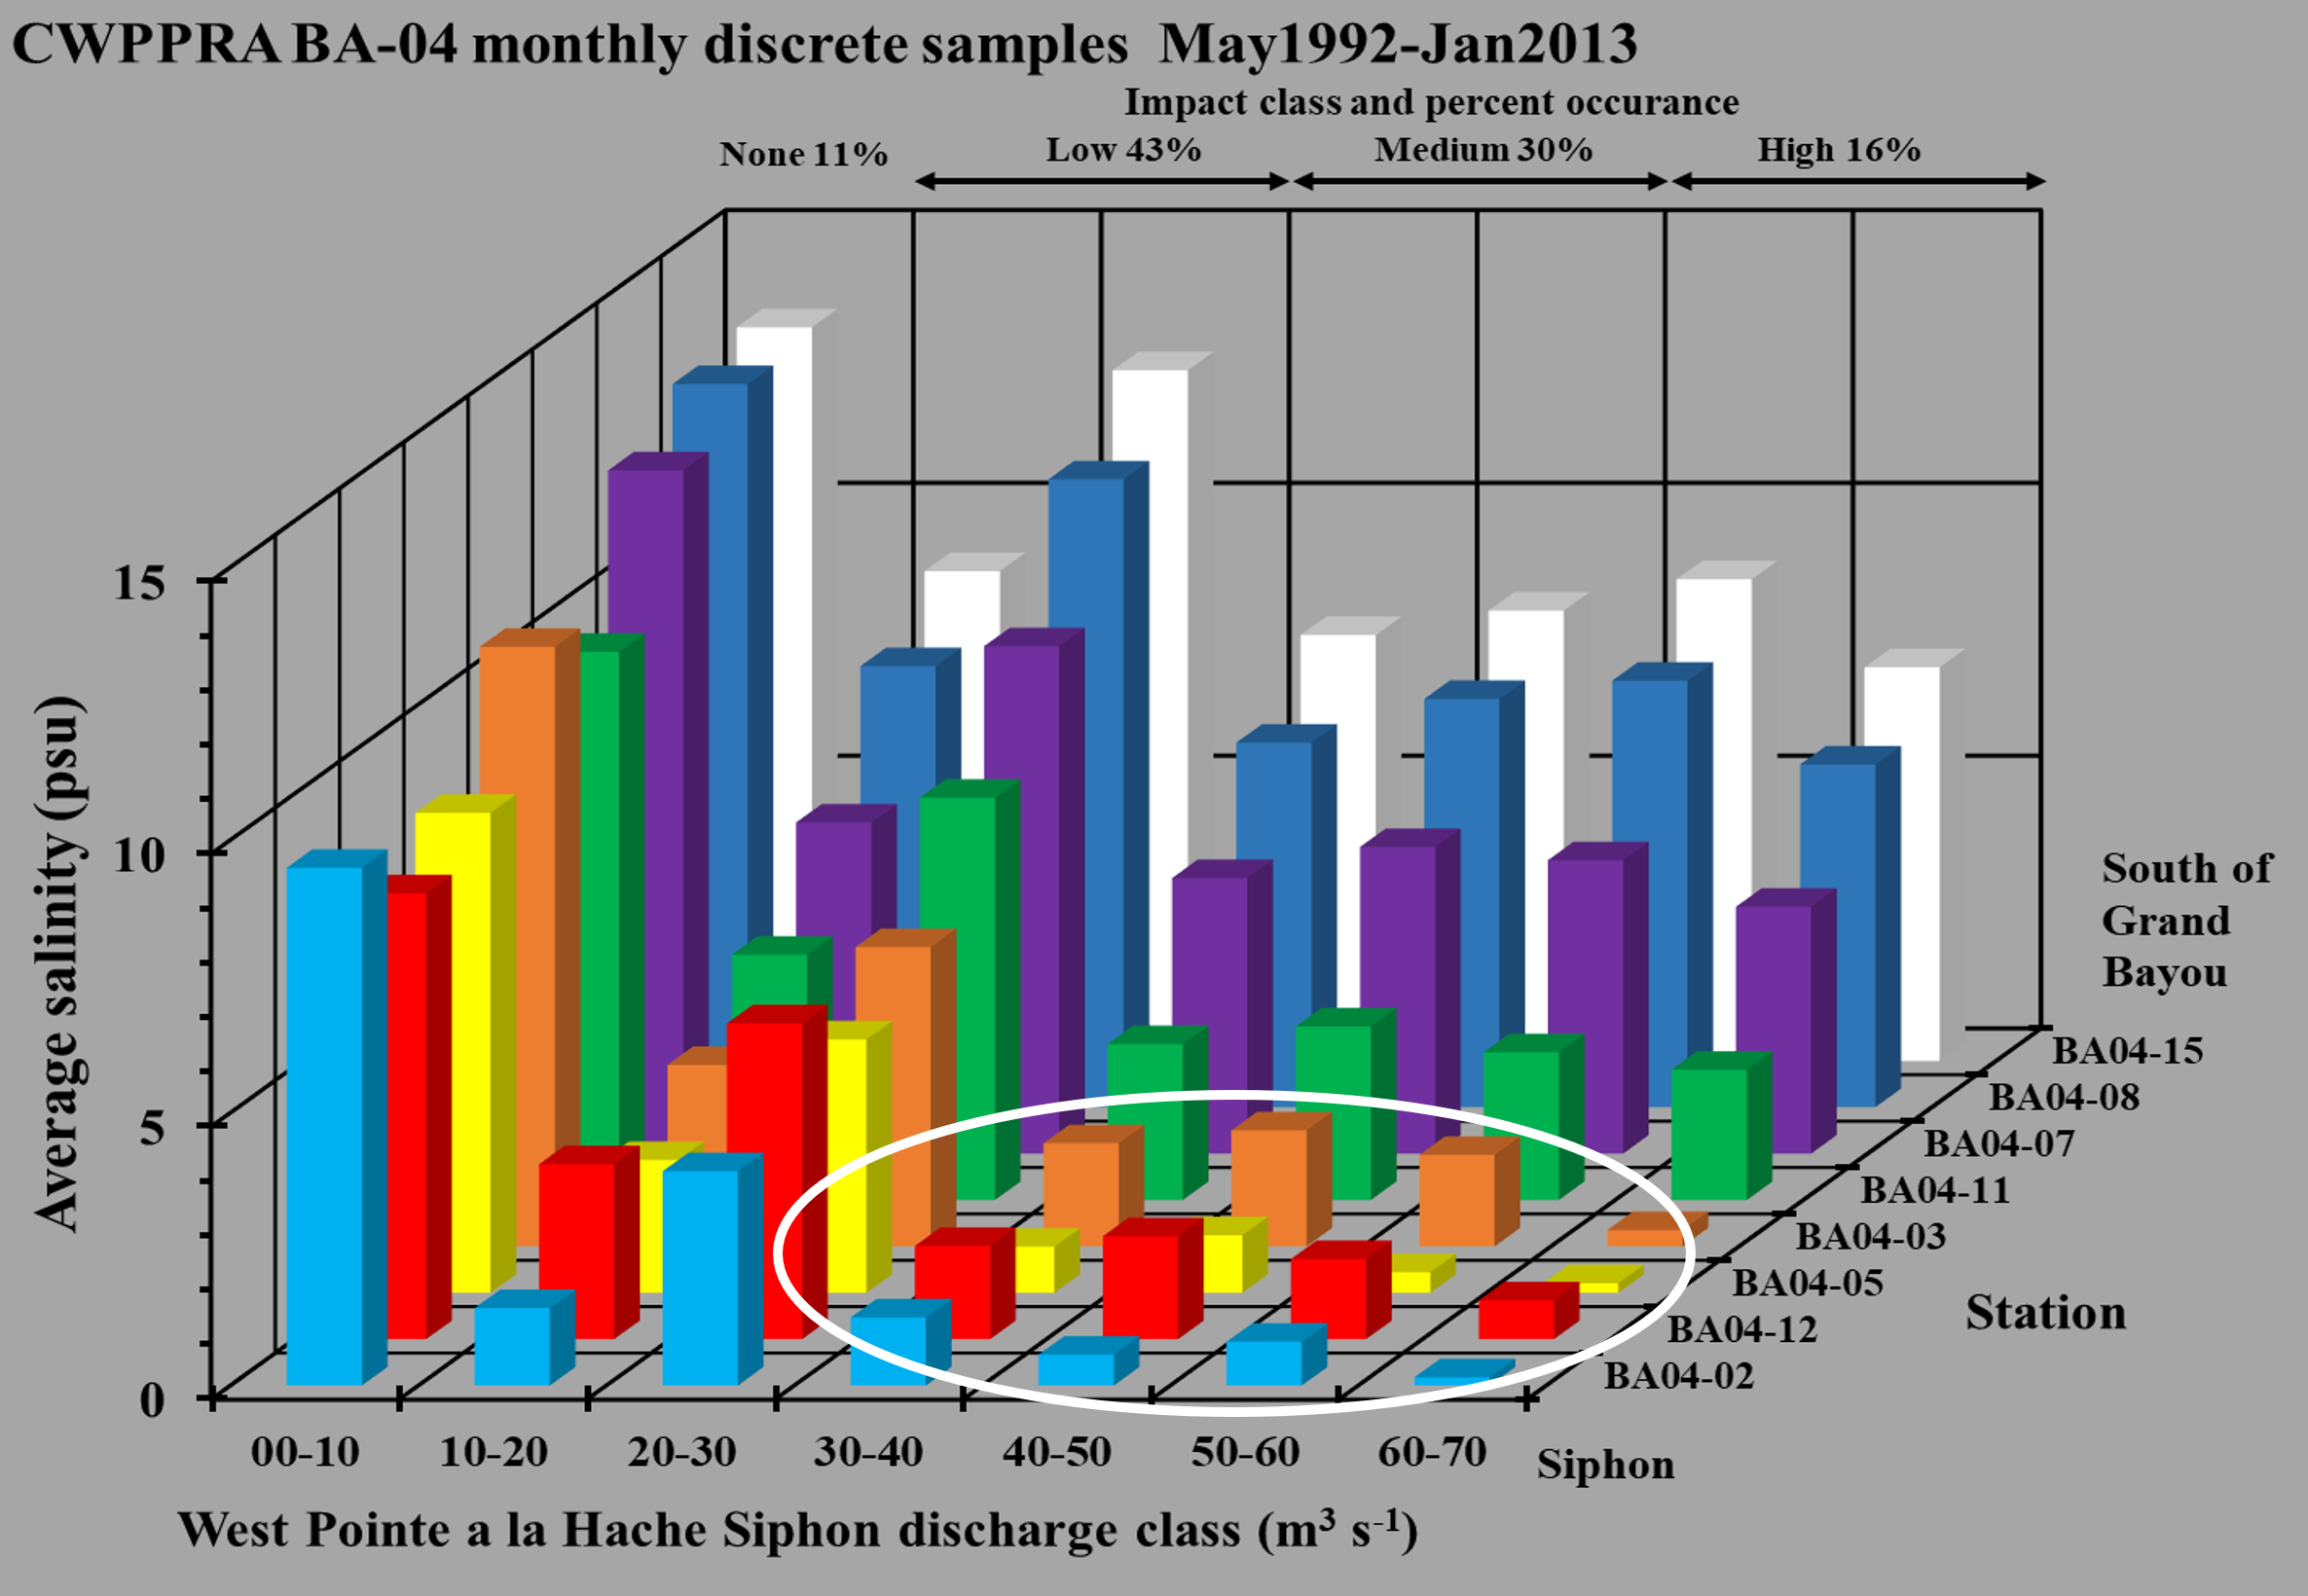
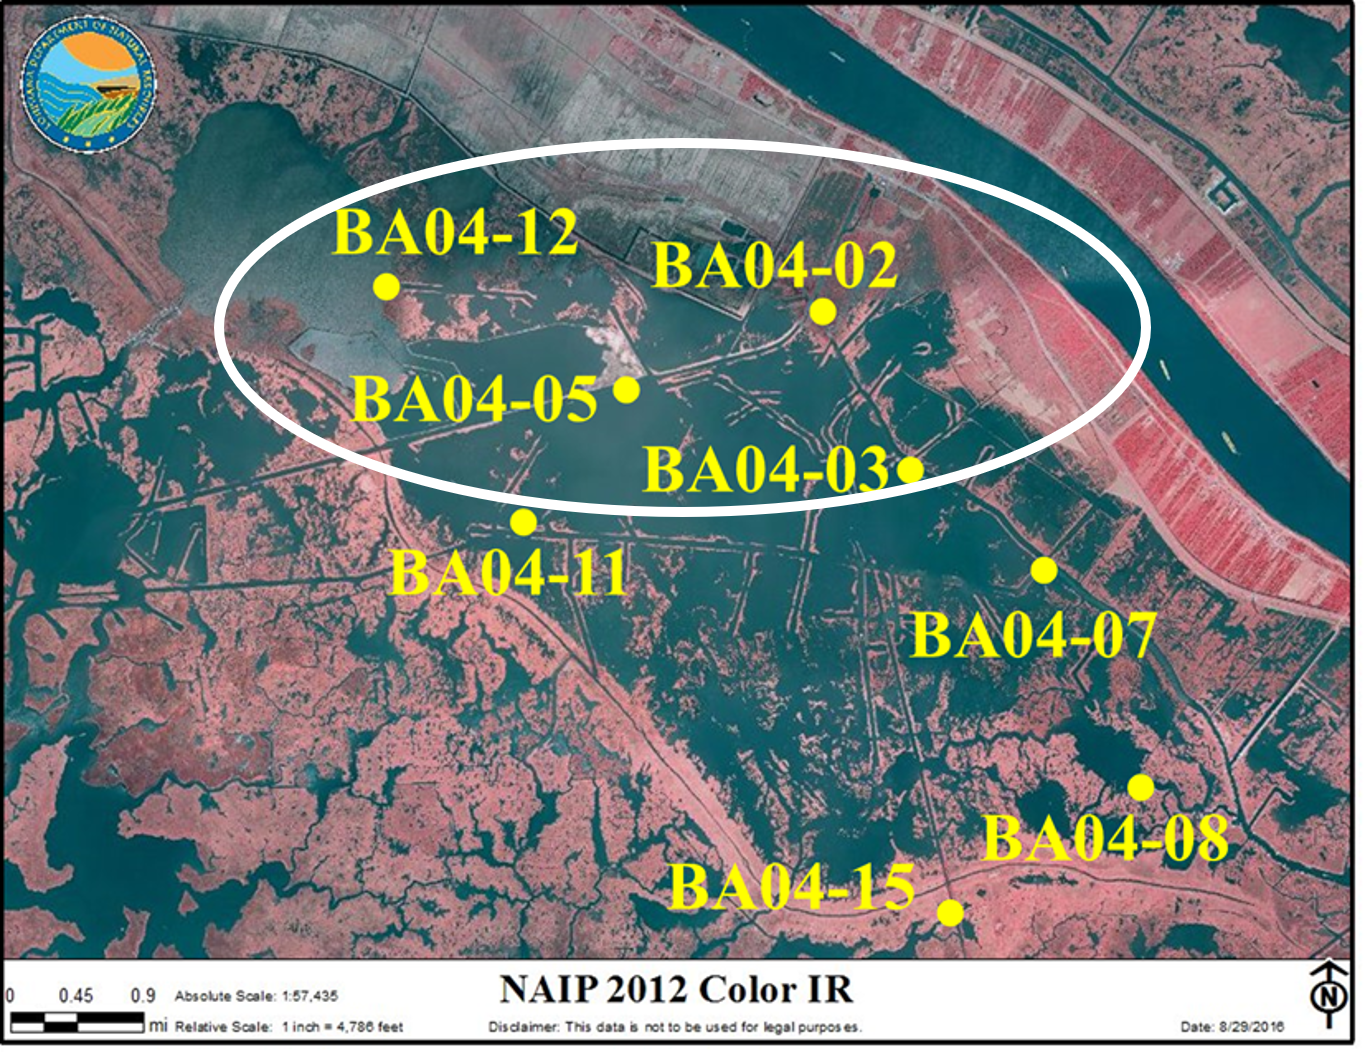
CWPPRA BA-04 Project stations 1993-2013 Boshart and MacInnes, 2000
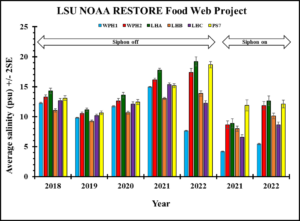
Summary of monthly average salinity for CRMS stations by regions
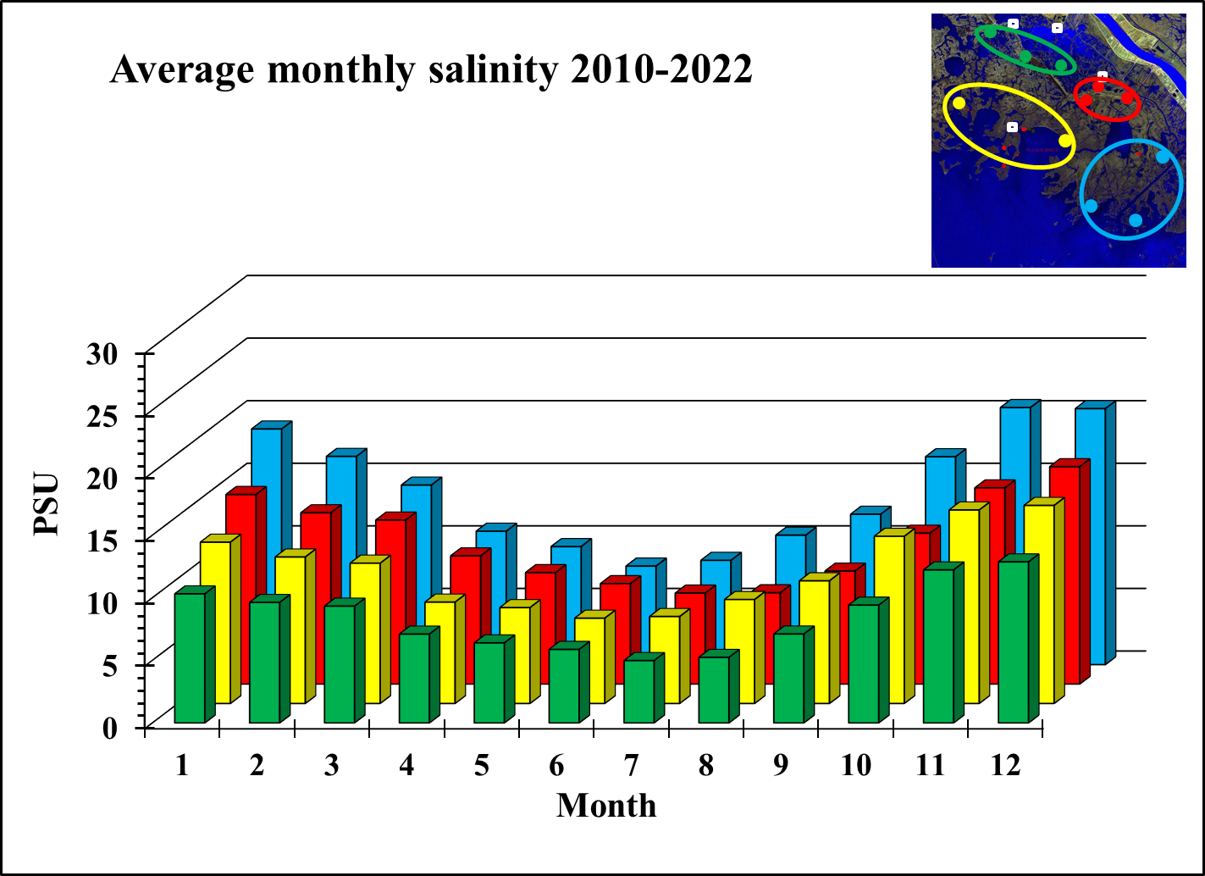
- The strong seasonal pattern with highest salinities is in the fall and winter.
- North to South salinity gradient is ~8 psu in the fall and winter and ~2-3 psu in the spring and summer
Marsh elevations from the LSU RTK surveys
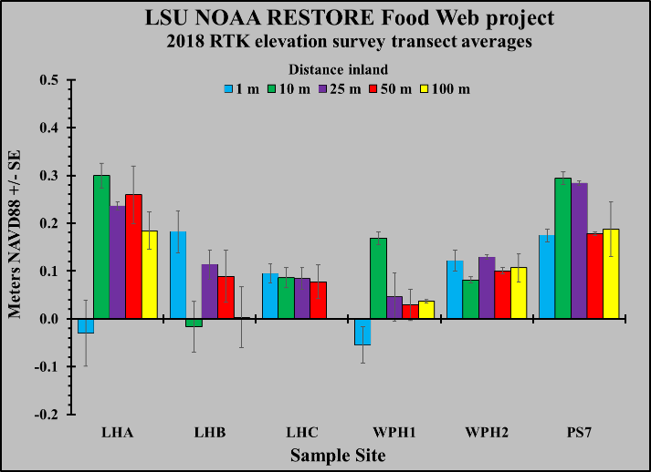
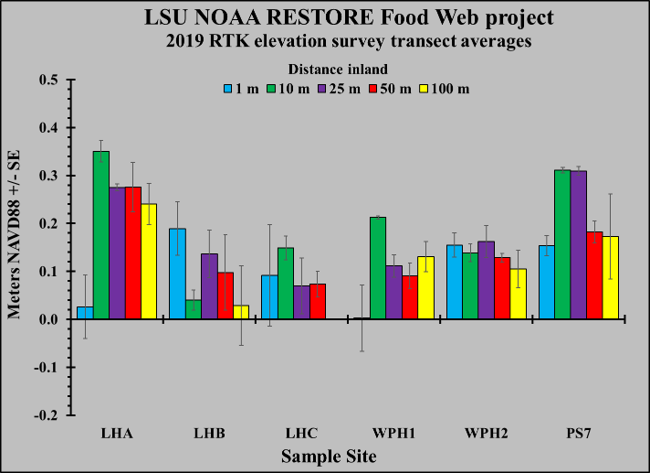
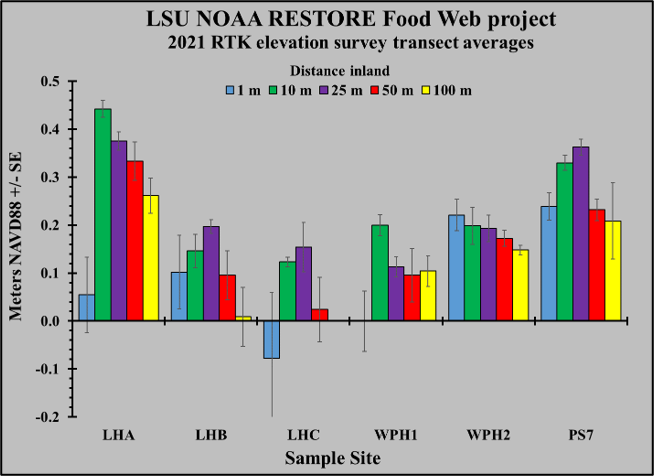
Marsh elevation comparison for CRMS and LSU stations
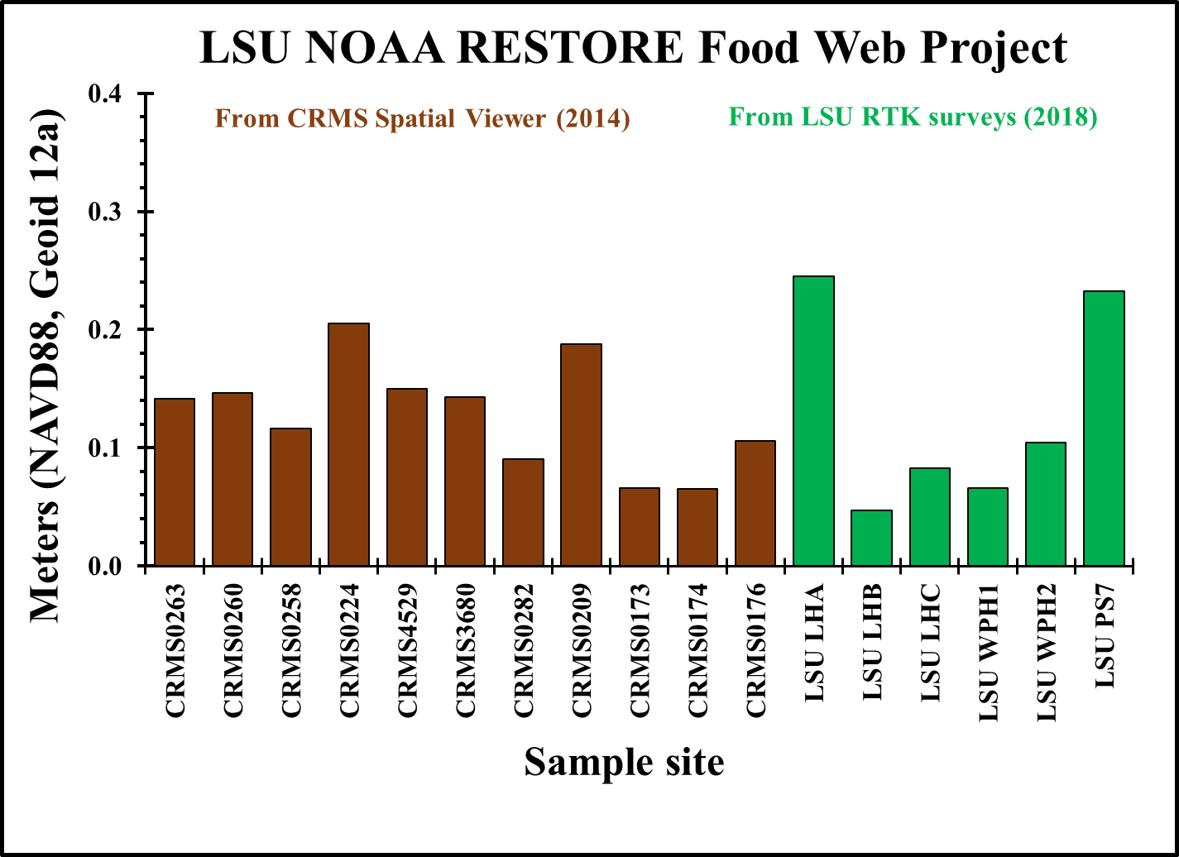
- The LSU and CRMS marsh elevations range from ~0.05 m NAVD88 to ~0.2 m NAVD88 with the exception of LHA and PS7 which are closer to ~0.25 m NAVD88.
- LHA is a created marsh and PS7 is further south which has a greater water level range.
Summary of average marsh inundation for CRMS stations by regions in the LSU NOAA RESTORE Food Web Project
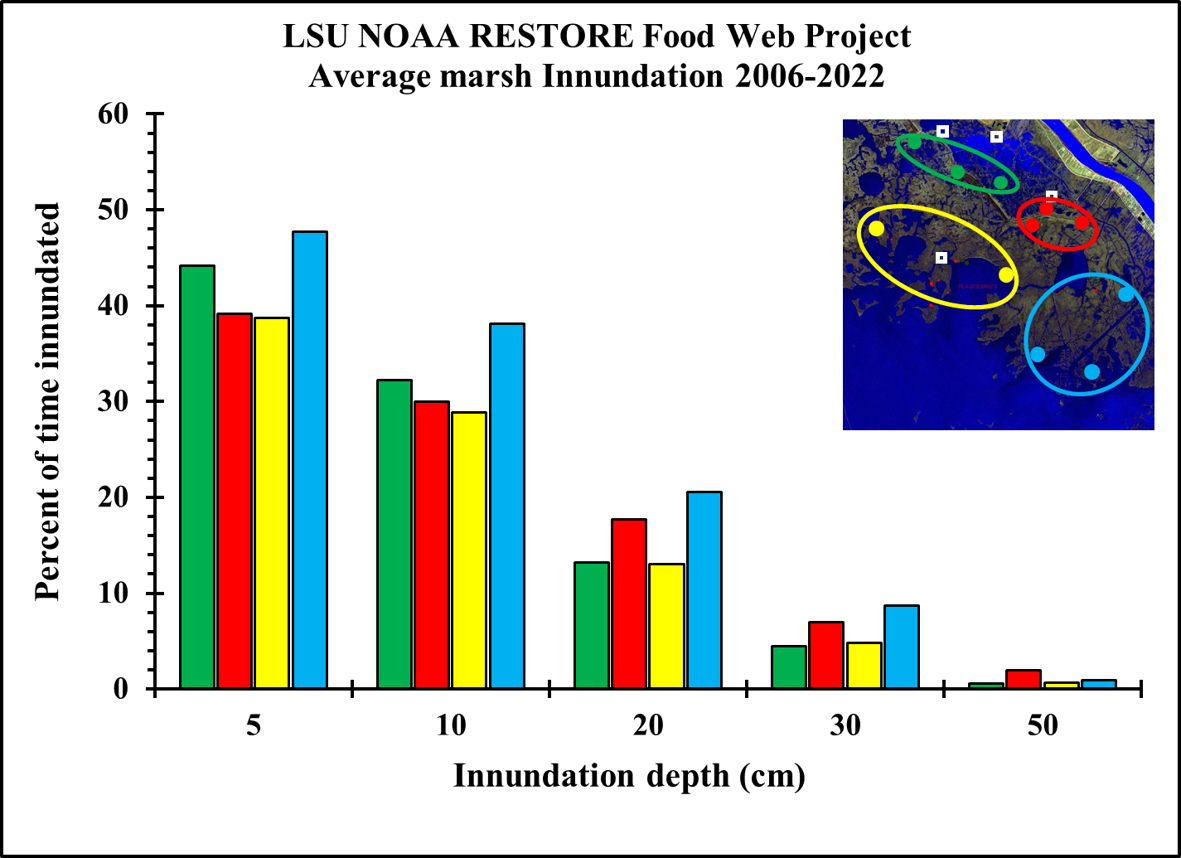
- The southeast region (blue) has a higher level of inundation most likely due to greater tidal connectivity.
- The CRMS data was used with the LSU RTK survey data to compute daily marsh inundation for decomposition bags set out in the LSU sample sites (white boxes). Decomposition bags were set out along three transects at each of the LSU sites at 1, 10, 25, 50 and 100 meters inland.
Annual average marsh elevations and inundation
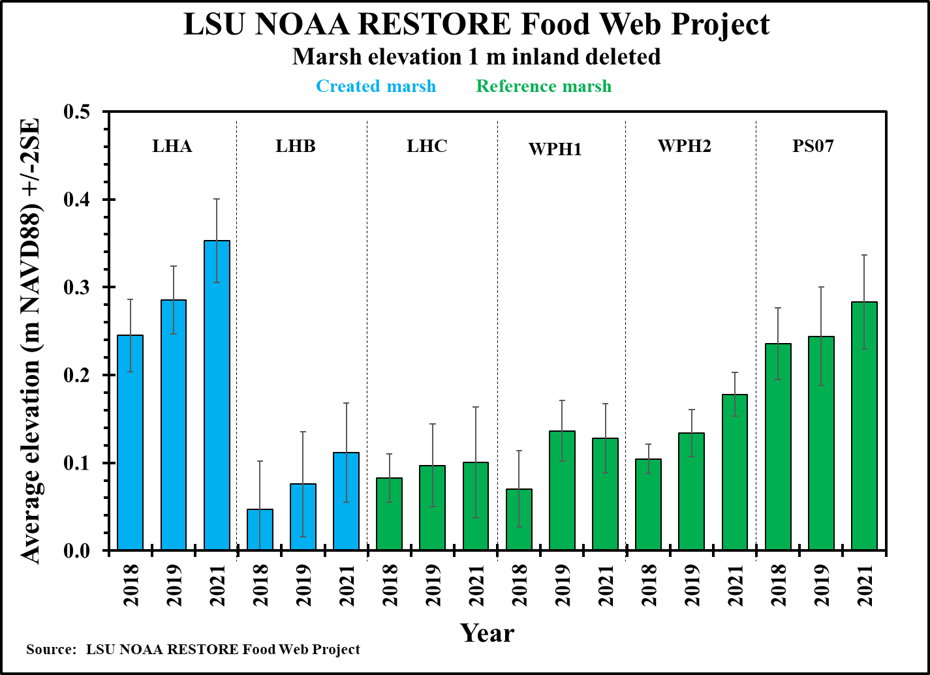
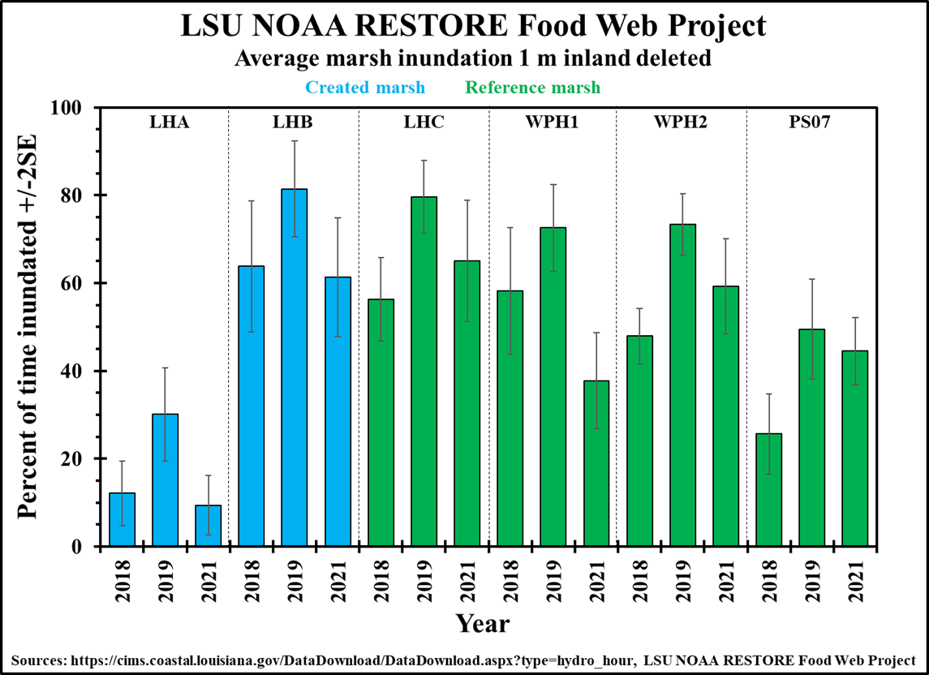
Annual average marsh elevations and inundation
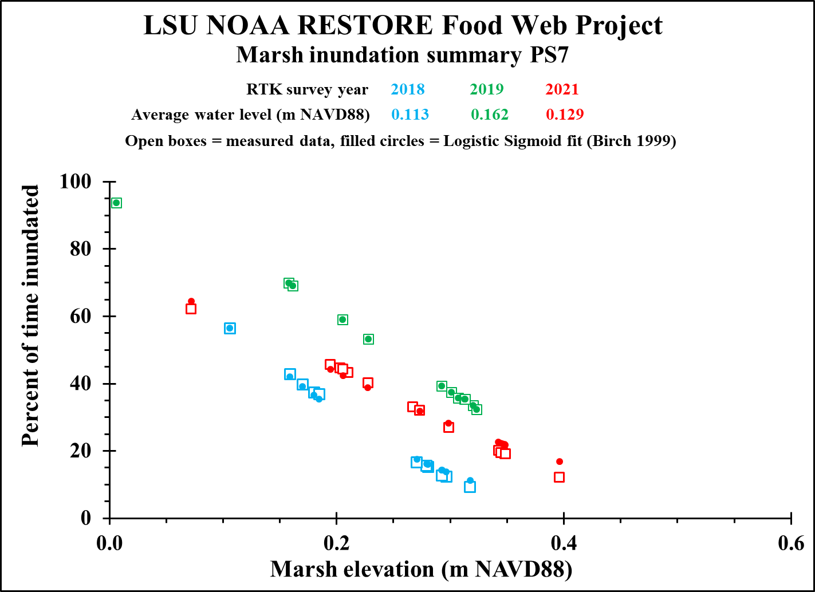
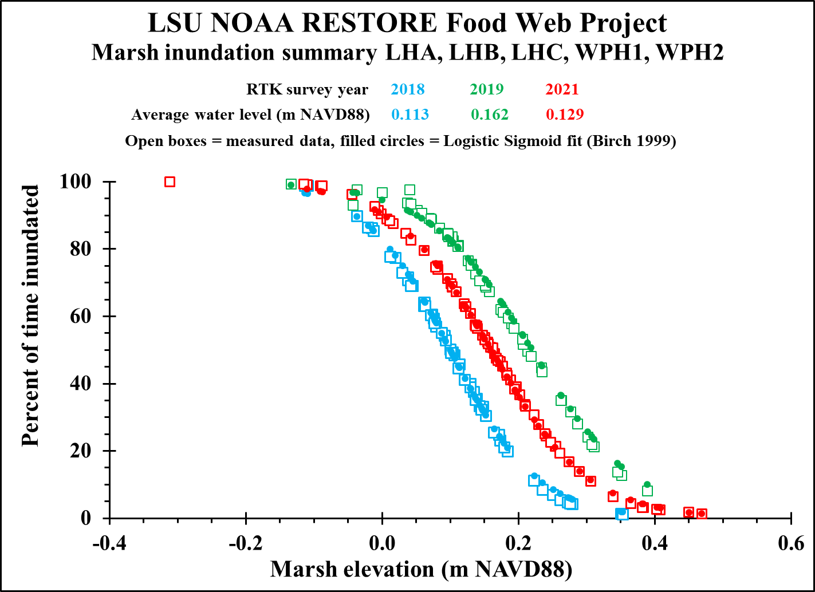
- Logistic Sigmoid growth curves (filled circles) were fit to the inundation data (boxes), using an equation from Birch, 1999). PS7 was fit by itself since it used flooding data from CRMS4529 located close to the site. Note that the curves shift to the right (higher inundation) with higher mean water levels.
Data fit using a Logistic Sigmoid Growth Equation from Birch, 1999
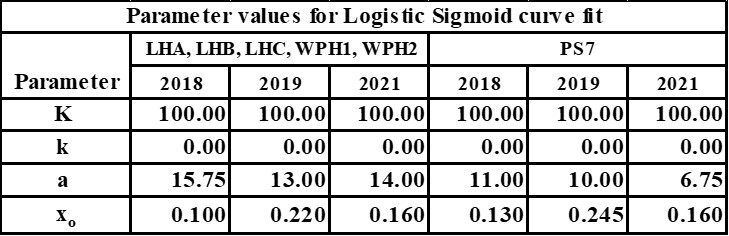
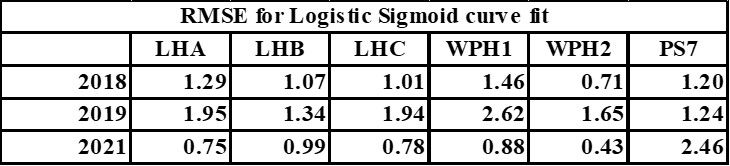
- The curve fits were very good in all cases with the Root Mean Square Error (RMSE) ranging from 0.75% to 2.6%
- Birch, C. P. D. 1999. A New Generalized Logistic Sigmoid Growth Equation Compared with the Richardson Growth Equation. Annals of Botany 83: 713-723.


Overall average marsh elevations and inundation

Overall average marsh elevations and inundation
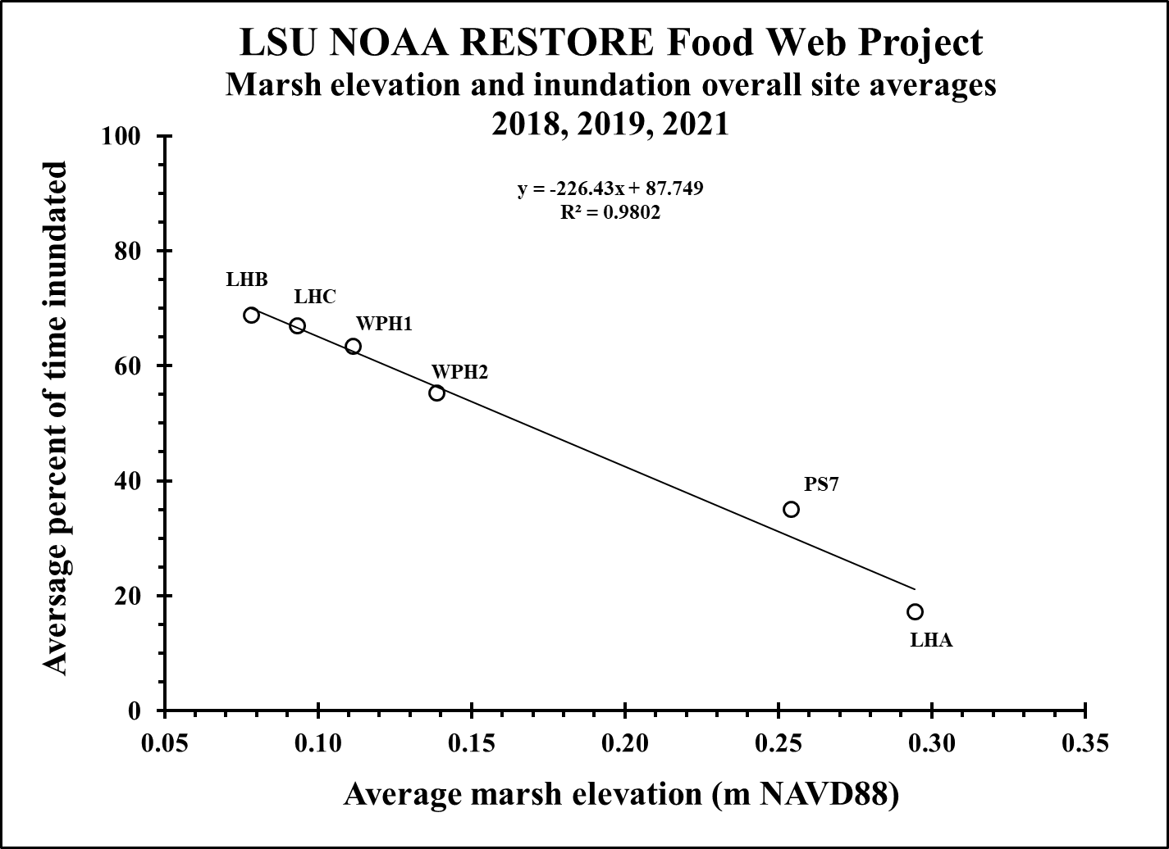
- The overall averages (data from all years combined) show a decrease in inundation from~70% of the time for marsh elevations of ~0.75 m NAVD88 to ~20% of the time for marsh elevations of ~0.30 m NAVD88, with the created marsh at LHA having the least amount of inundation.
Average decomposition rate and decomposition coefficient as a function of marsh inundation
Preliminary results, subject to revision and not for citation.
- Decomposition (grams per day) and the decomposition coefficient both exhibit an increase with increased marsh inundation. There is no statistical difference between the created and reference marshes.
- Preliminary results, subject to revision and not for citation.
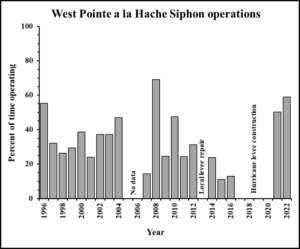
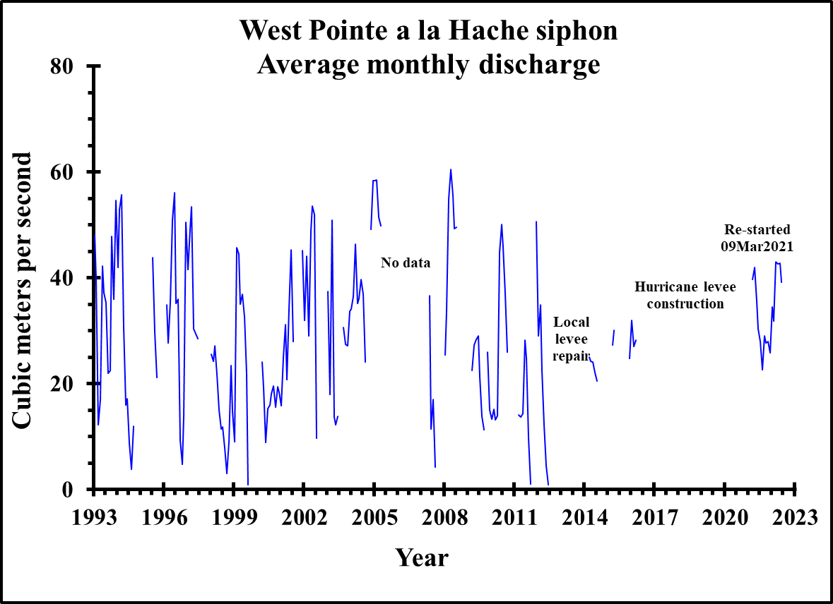
 The annual West Pointe a la Hache siphon operation varied from years when it was operated ~10% of the time to years when it operated ~80% of the time. The monthly average discharge, when operating, ranged from ~5 m3s-1 to ~60 m3s-1.

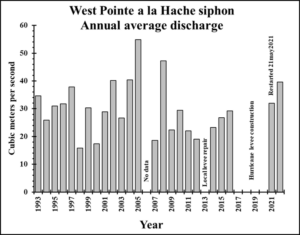
 The average annual West Pointe a la Hache siphon discharge when operating, ranged from ~15m3s-1 to ~55m3s-1. The siphon discharge was classified into no, low, medium and high discharge classes. Most (75%) of the discharge fell into to low or moderate classes with the high impact class occurring ~15% of the time.


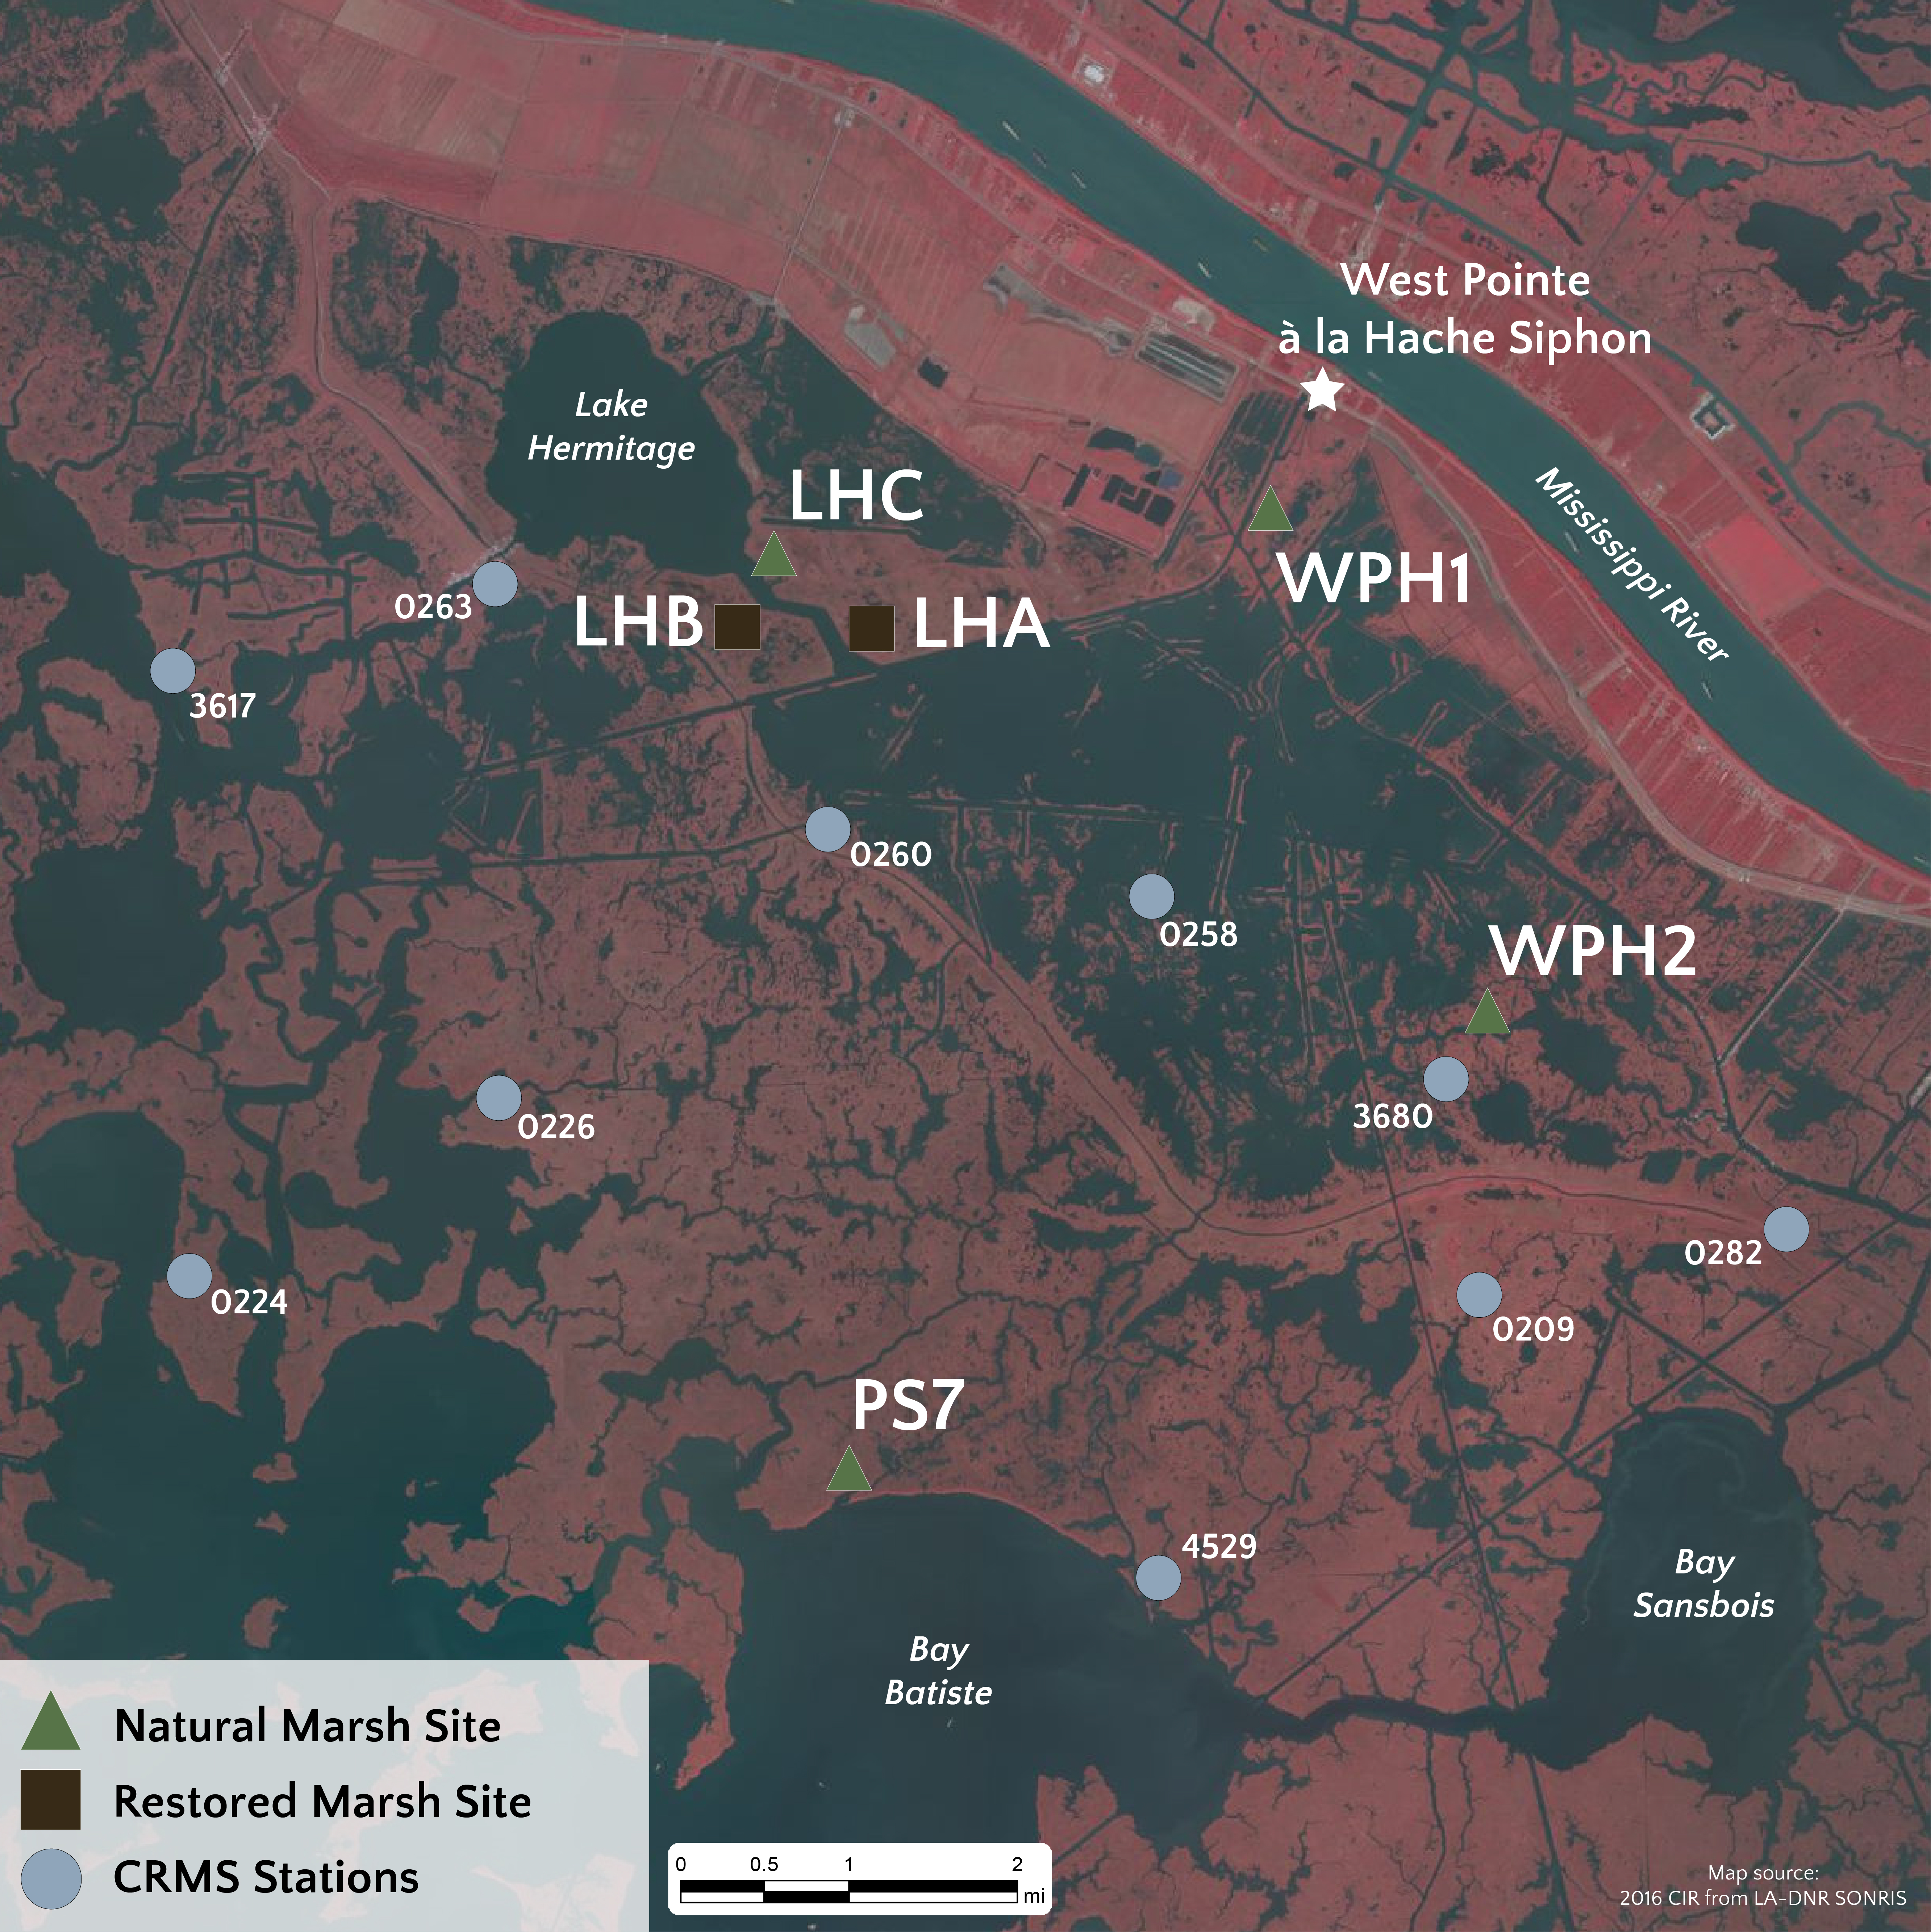
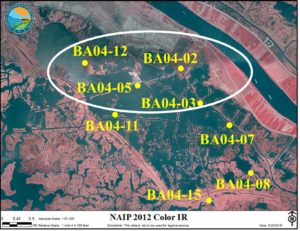 Analysis of data collected for the CWPPRA BA-04 Project indicated that the siphon influence on salinity was strongest at stations in the northwest region of the study area. This corresponds to the locations for sites LHA, LHB, LHC and WPH1 for the LSU NOAA RESTORE Food Web Project
- All stations from the LSU NOAA RESTORE Food Web project had a decrease in salinity with siphons.
- The largest decrease (6.5 psu, 57.5% decrease) occurred at WPH1 (closest station to the siphon) and the smallest (2.0 psu, 14.3% decrease) occurred at PS7 (furthest from the siphon).

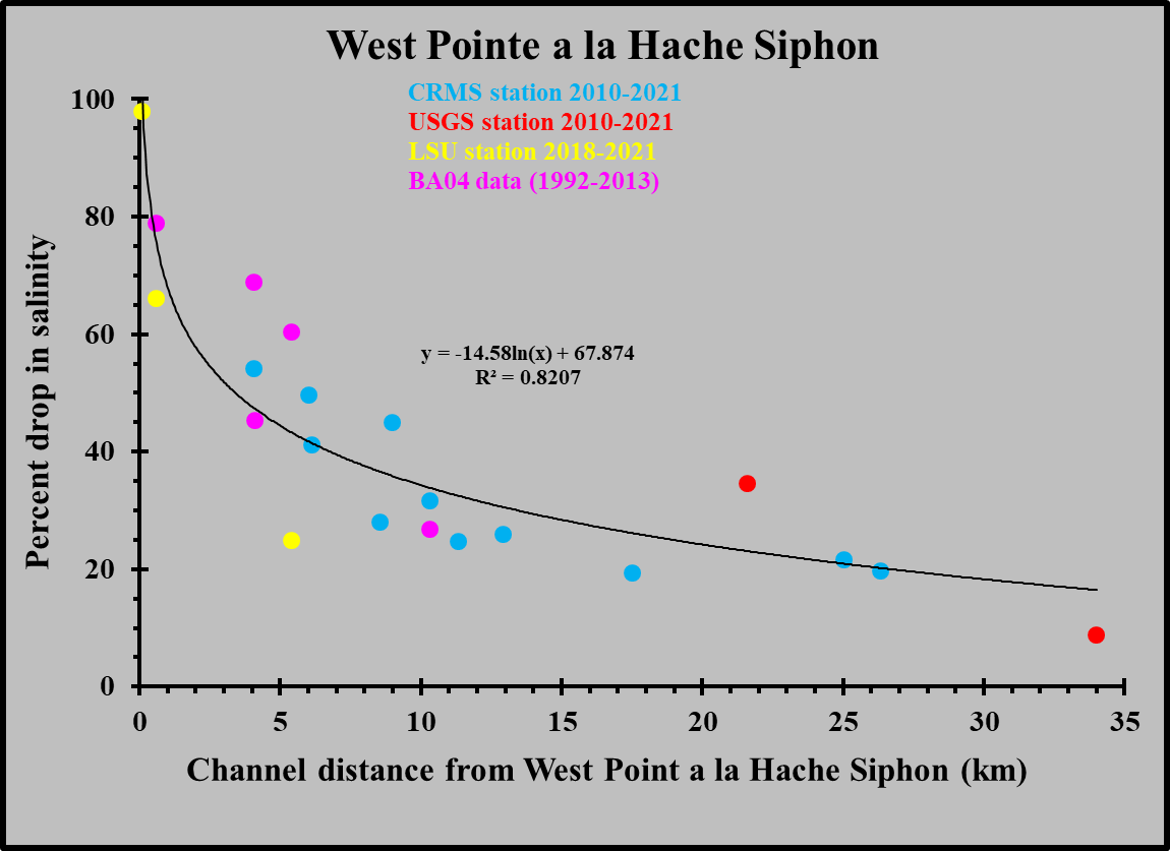
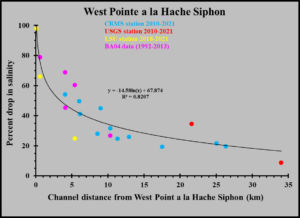 The overall percent drop in salinity as a function of the channel distance from the siphon was calculated using the data from all sources (CWPPRA BA-04, CRMS, USGS, LSU NOAA RESTORE FOOD WEB PROJECT). The data show a logarithmic decrease from ~90% for the outfall channel to ~10% for a station 35 km away.
Hydroperiod Analysis Summary
- The LSU sondes were compared to CRMS3680
- Water temperature correlations were >0.9 for all data
- Salinity correlations were >0.9 for 70%of the stations
- Water level correlations were >0.9 for 78% of the stations
- This allowed CRMS3680 to be used an index station.
- The study area salinity has a seasonal pattern with highest salinities in the fall and winter. The North to south salinity gradient is ~8 psu in the fall and winter and ~2-3 psu in the spring and summer.
- The LSU and CRMS marsh elevations rang from ~0.05 m NAVD88 to ~0.20 m NAVD88 with the exception of LHA and PS7 which are closer to ~0.25 m NAVD88. LHA is a created marsh and PS7 is further south which has a greater water level range.
- Marsh inundation as a function of elevation followed a Logistic Sigmoid growth curve (Birch, 1999). The overall averages (data from all years combined) show a decrease in inundation from~70% of the time for marsh elevations of ~0.75 m NAVD88 to ~20% of the time for marsh elevations of ~0.30 m NAVD88, with the created marsh at LHA having the least amount of inundation.
- Decomposition (grams per day) and the decomposition coefficient both exhibit an increase with increased marsh inundation. There was no statistical difference between the created and reference marshes.
- The annual West Pointe a la Hache siphon operation varied from years when it was operated ~10% of the time to years when it operated ~80%. The average annual West Pointe a la Hache siphon discharge when operating, ranged from ~15m3s-1 to ~55m3s-1. The siphon discharge was classified into no, low, medium and high discharge classes. Most (75%) of the discharge fell into to low or moderate classes with the high impact class occurring ~15% of the time.
- Analysis of data collected for the CWPPRA BA-04 Project indicated that the siphon influence on salinity was strongest at stations in the northwest region of the study area. This corresponds to the locations for sites LHA, LHB, LHC and WPH1 for the LSU NOAA RESTORE Food Web Project.
- All stations from the LSU NOAA RESTORE Food Web project had a decrease in salinity with siphon operations. The largest decrease (6.5 psu, 57.5% decrease) occurred at WPH1 (closest station to the siphon) and the smallest (2.0 psu, 14.3% decrease) occurred at PS7 (furthest from the siphon).
- The overall percent drop in salinity as a function of the channel distance from the siphon was calculated using the data from all sources (CWPPRA BA-04, CRMS, USGS, LSU NOAA RESTORE FOOD WEB PROJECT). The data show a logarithmic decrease from ~90% for the outfall channel to ~10% for a station 35 km away.
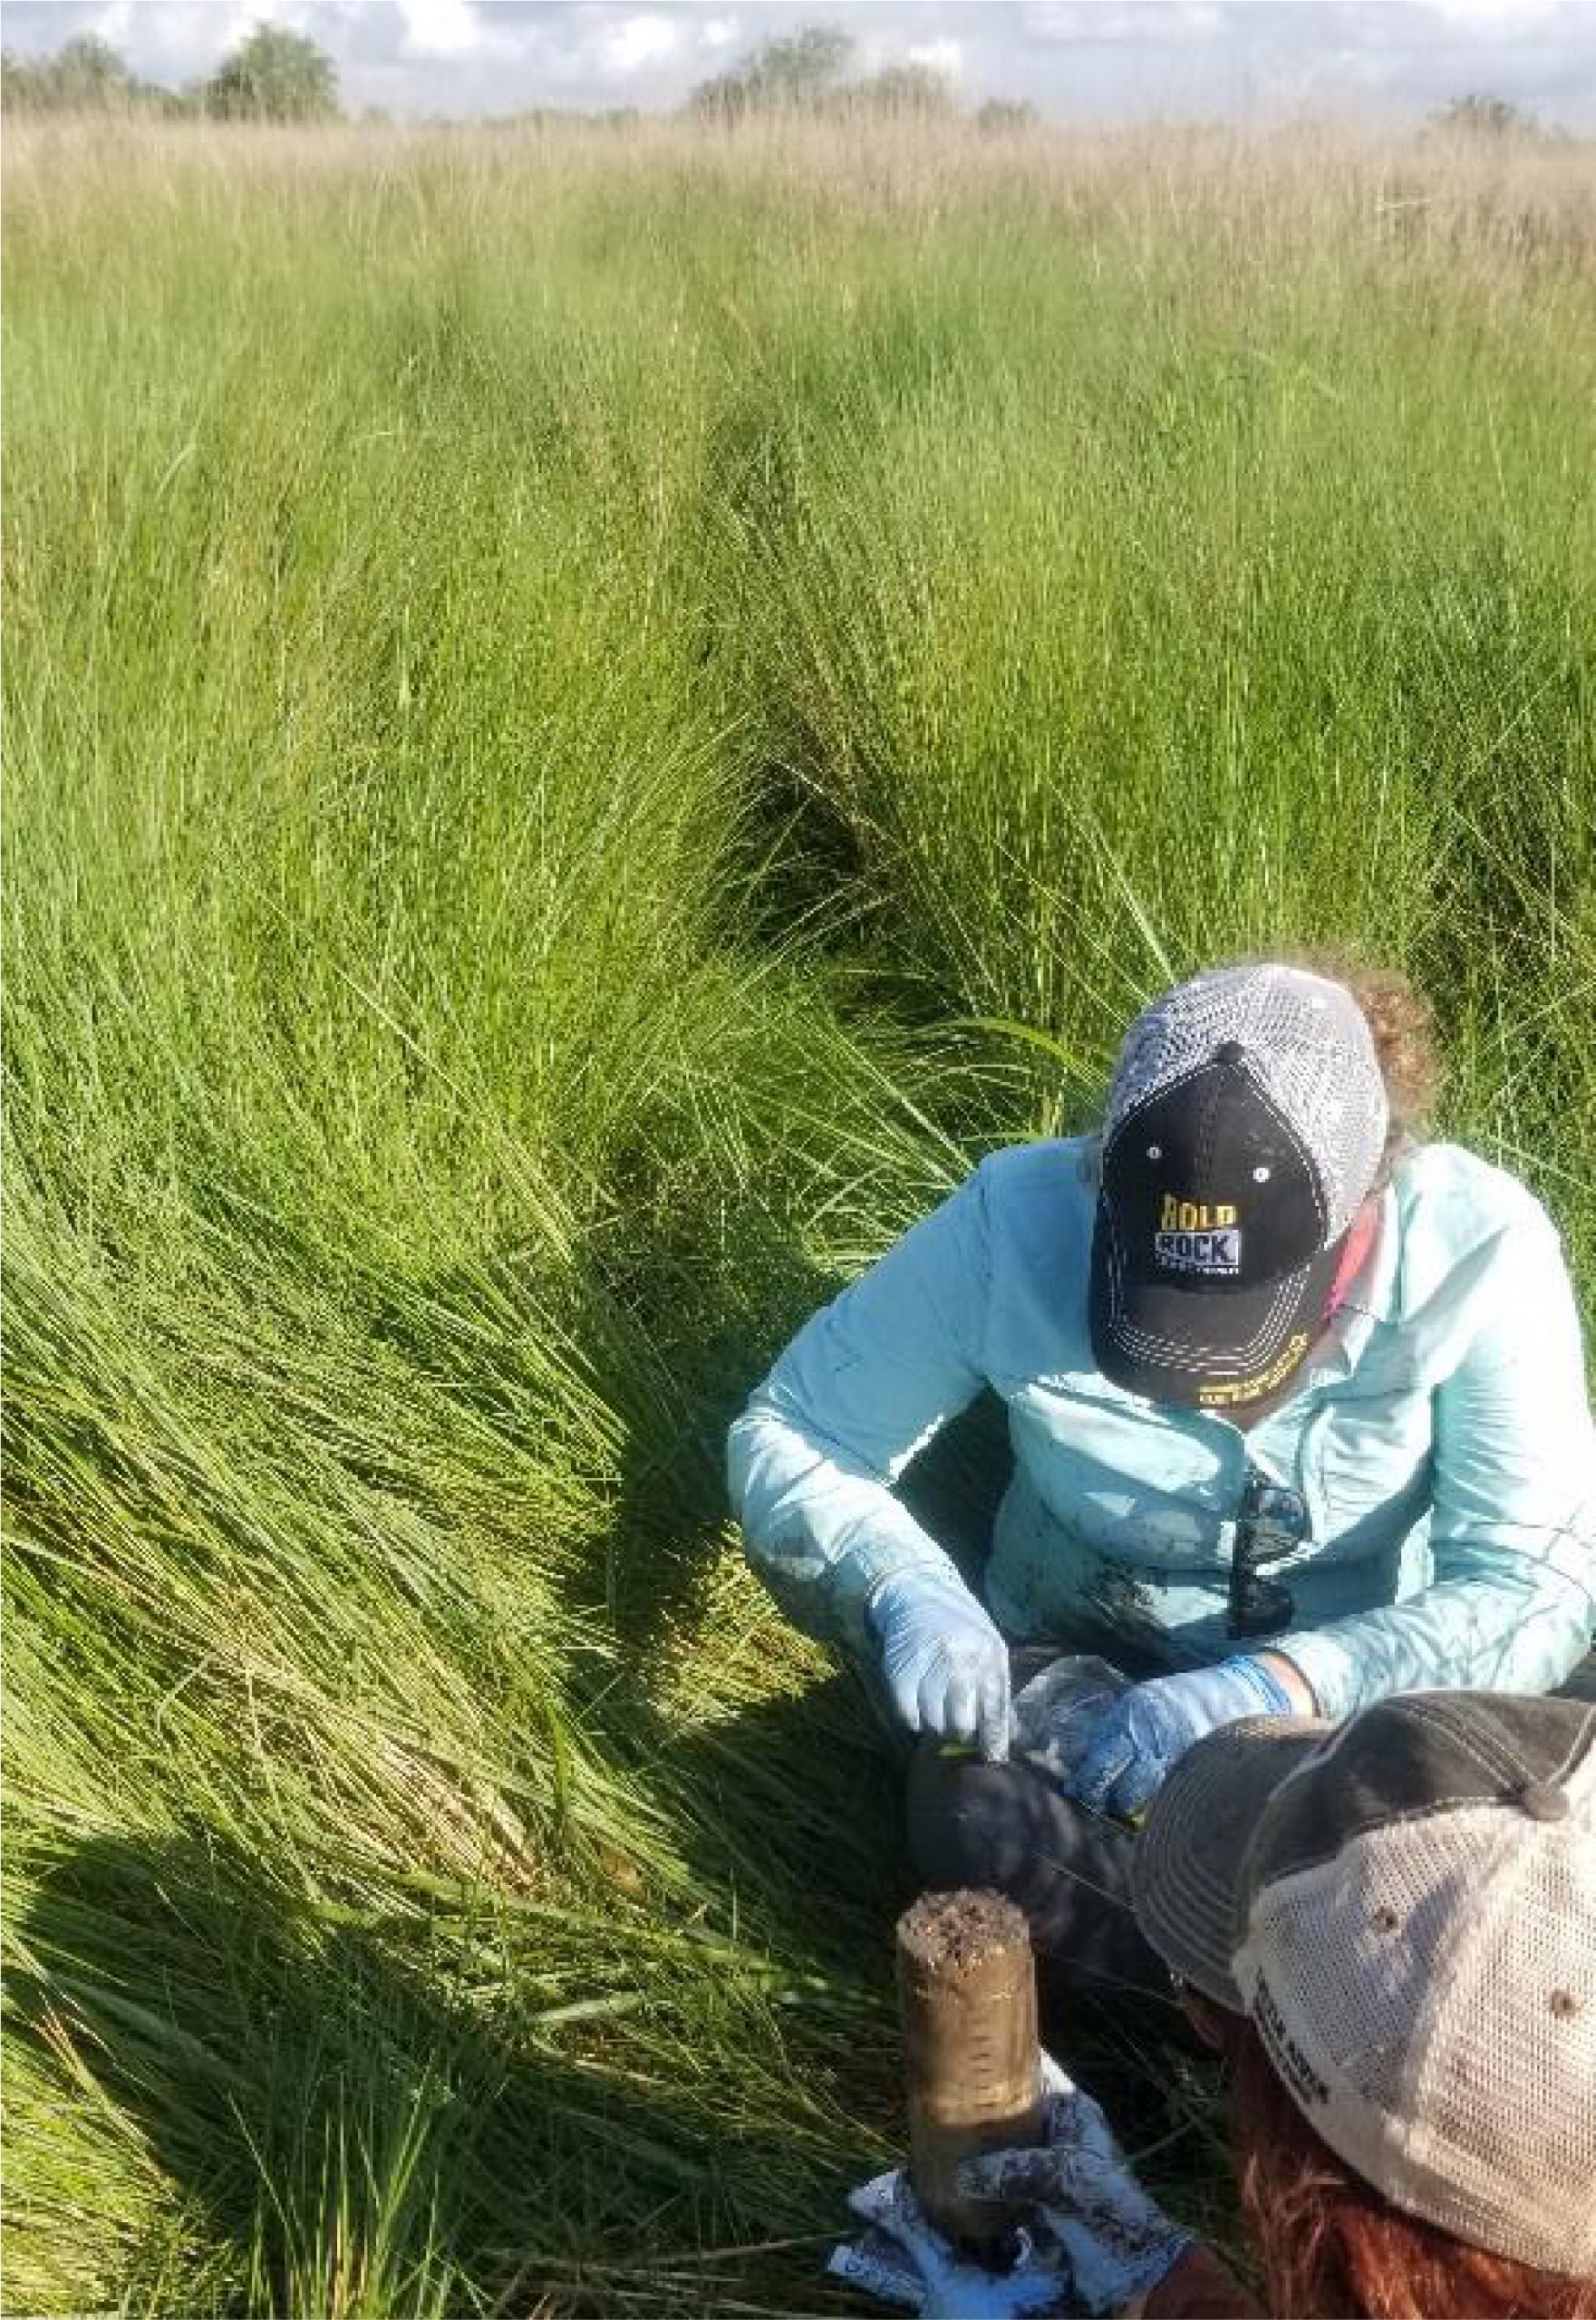
Primary Producers
(Roberts)
![]()
Field Work: May 2018 & 2019
- 5 distances from edge (1, 10, 25, 50, 100 m)
- 3 transects in 2018; 2 plots on single transect in 2019
- Determine biomass (aboveground clip plot) and collect plants for biomarkers)
- Sediment and water column chlorophyll
- Ancillary data: organic matter, C and N, bulk density, water content, pore water salinity, pH)
Key Findings
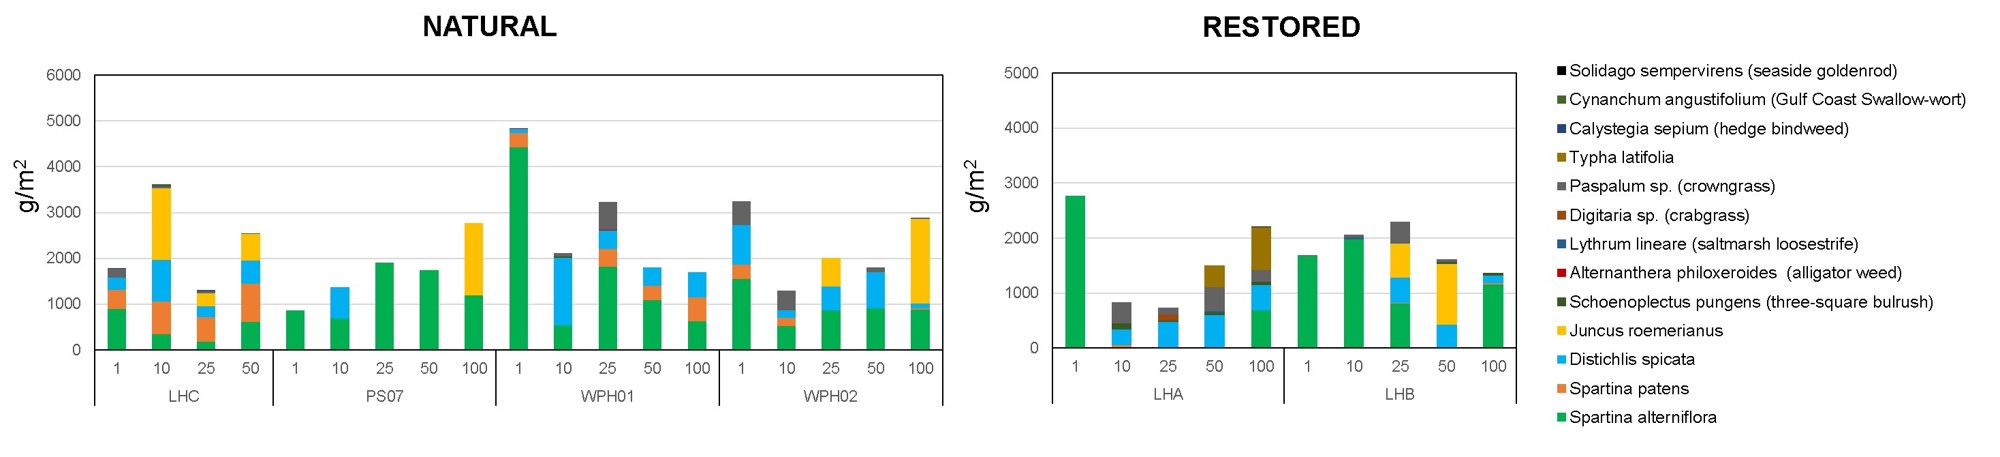
- Overall magnitude of aboveground biomass similar between years; no consistent pattern with distance.
- Trend of decrease along salinity gradient in 2018, weaker in 2019.
- Biomass lower in high elevation restored marsh (LHA) than natural marsh(LHC); Biomass in restored marsh (LHB) more similar to the natural marsh (LHC).
- Overall aboveground richness similar between years.
- Richness decreases with salinity.
- Richness lower in restored marshes than control sites in 2018; species richness was similar at lower elevation restored marsh (LHB) and natural marsh (LHC) compared to the higher elevation restored marsh (LHA) site.
- Many species in one of the restored marshes (LHA) were not typical of brackish wetlands.
- No clear patterns in benthic chlorophyll by site or distance.


Key Findings

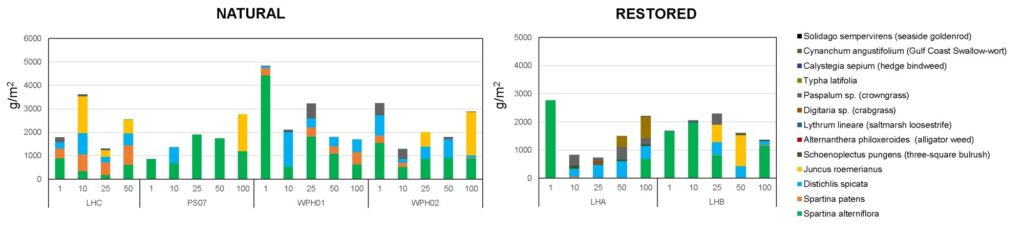
 Aboveground Biomass
- LHA has the lowest biomass (1319-1352 g/m2)
- LHB (1571-1950 g/m2) is more like reference sites (LHC: 1814-1808 g/m2; WPH2: 1808-2665 g/m2).
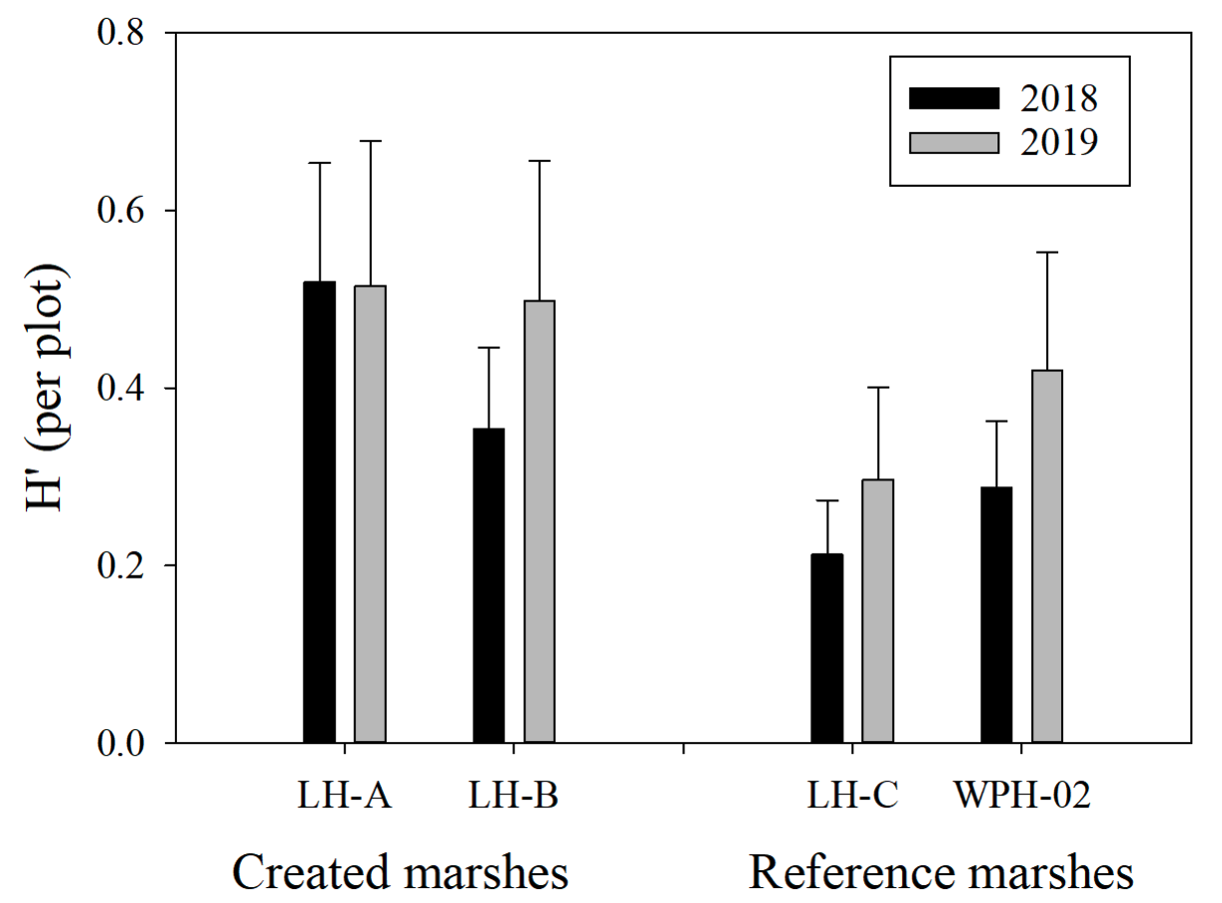
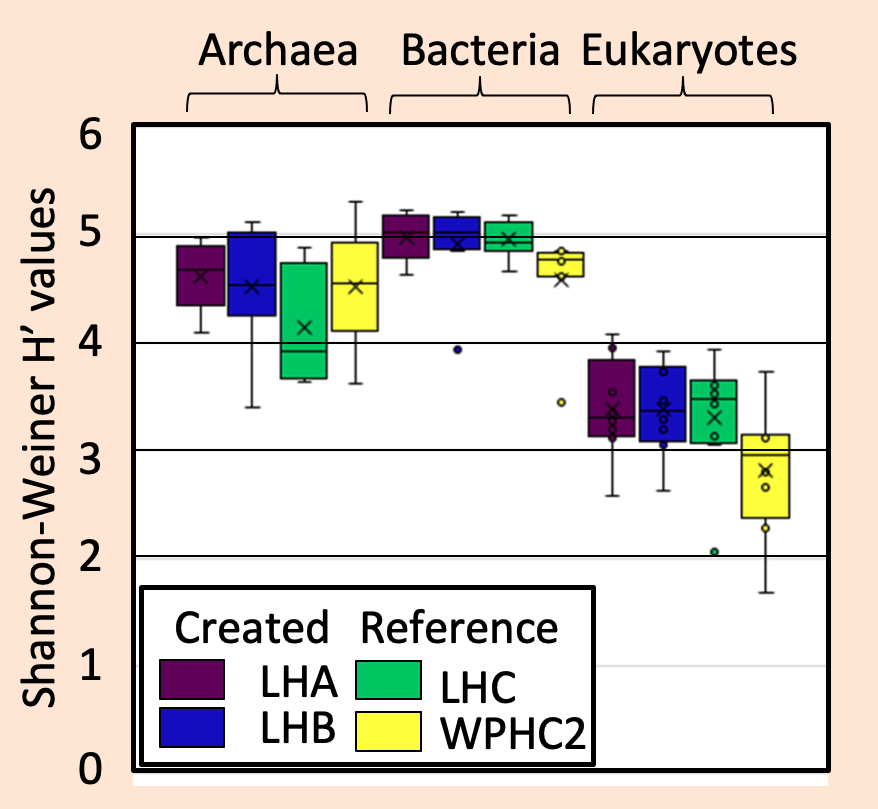
Species Diversity (H’) & Similarity (SD)
- Slightly higher diversity & species richness in created marshes.
- Highest diversity at LHA with many species not typical of wetlands.
- LHB is more similar to the reference marshes (88-90%) than it is to LHA (~66%).
Litter Bag Decomposition & Macroinvertebrates
(Lopéz-Duarte, Polito, Roberts)
Field Work: May & July 2019
- 1 transect per site, 5 distances from edge (1,10,25,50,100*m)
- 5 replicate Spartina alterniflora litter bags per distance deployed for 2 months
Key Findings
- Spartina alterniflora decomposition is highest in marshes that are flooded more due to lower elevation and a larger tidal range


Key Findings
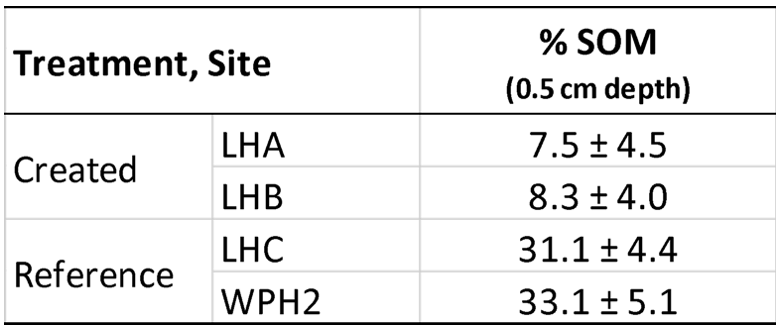 Soil Organic Matter (SOM) Content
- Created sites (LHA &LHB) have lower soil organic matter content than reference marshes.
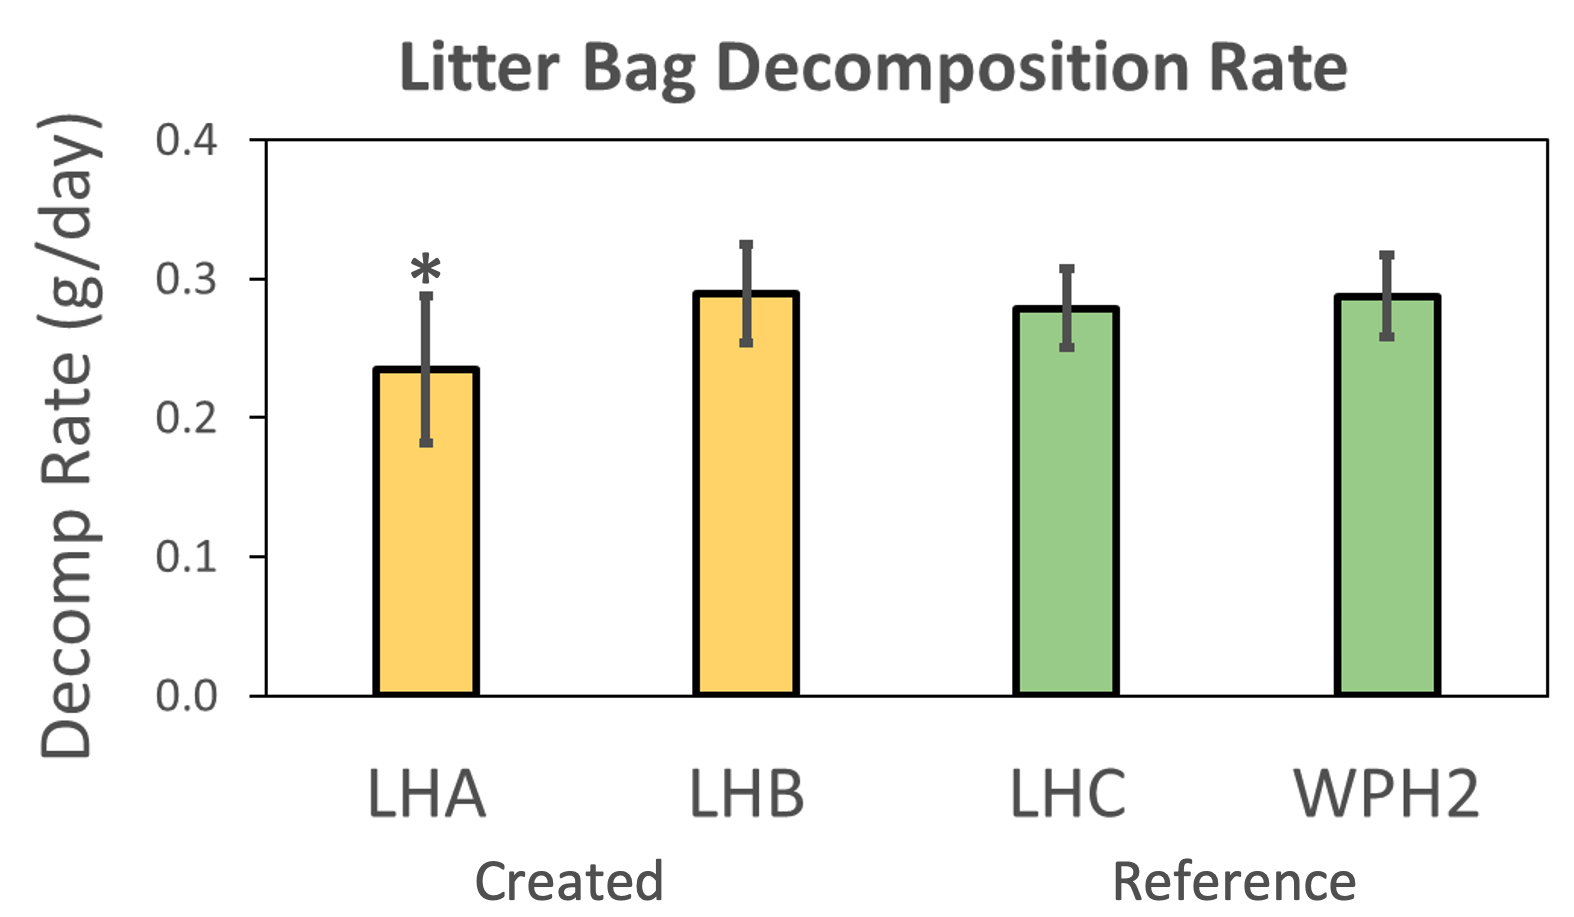
Spartina Litter Decomposition Rate
- LHA has a lower decomposition rate relative to the other created site (LHB) and the two reference sites (LHC & WPH2)
Litter Bag Decomposition Summary
Objectives
- To understand if and how litter loss and decomposition rates differ between created and natural marshes and between years.
- To understand the influence of marsh flooding on litter loss and decomposition rates.
Overview
- 4 Sites
- 2 Created
- 2 Natural
- 1 Transect per Site
- 5 Plots per Transect
- (1, 10, 25, 50, 100 meters)
- 5 Litter Bags per Plot
- 25 grams of Litter per Bag
- 2 Months Deployment
- Using a Trimble GNSS Receiver (Model R8), Data Collector/Controller (Model TSC2), and Cell Modem (Model TDL)
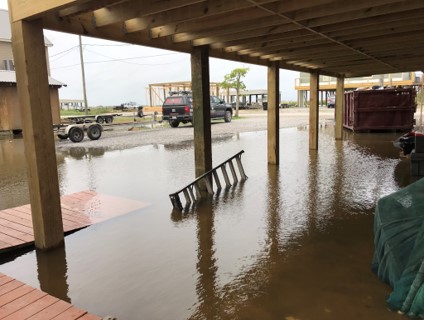
- Water levels were collected from the CRMS 3680. When the water level was 1 cm or more above a plot’s elevation, then it was considered flooded for that hour.
Results Decomposition Across Plots
- Litter loss was higher at the marsh edge (1 m plots) compared to marsh interior plots at LHA, LHB, and LHC (but not WPH2)
- LHA: p < 0.001, df = 4, f = 10.830
- LHB: p < 0.001, df = 4, f = 8.566
- LHC: p < 0.001, df = 3, f = 4.835
- WPH2: p < 0.088, df = 4, f = 2.196
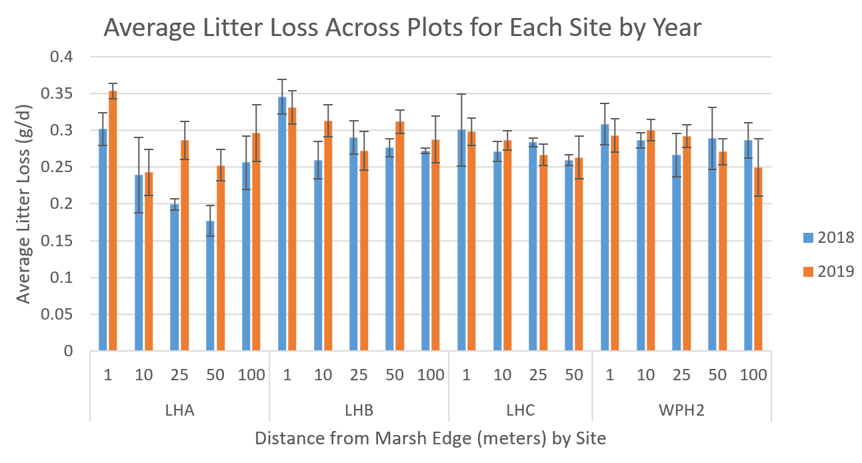
Results: Decomposition Across Sites and Years
- LHA saw the greatest change in Litter Loss and Decomposition Coefficient between years
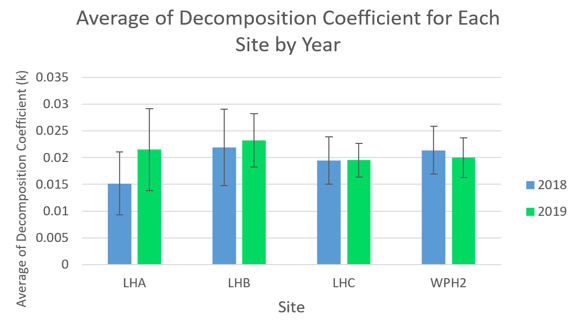
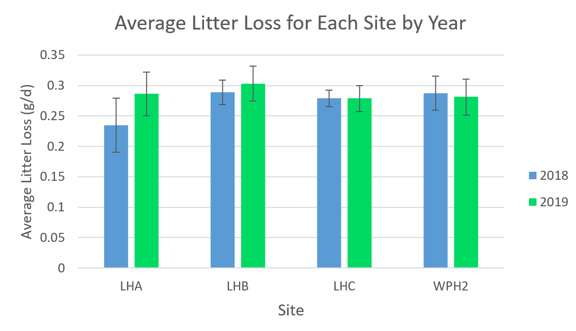
- Litter Loss and Decomposition Coefficient differed by site and year
- Litter Loss by Site: p < 0.001, df = 3, f = 7.663
- Litter Loss by year: p = 0.005, df = 1, f = 8.172
- Decomposition Coefficient by Site: p = 0.002, df = 3, f = 5.030
- Decomposition Coefficient by Year: p = 0.044, df = 1, f = 4.113
Results: Average Elevation Across Sites and Years
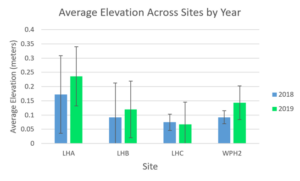 Elevation differed across sites and between years, with LHA having higher elevation than other sites both years.
- Mean Elevation (meters) by Site: p < 0.001, df = 3, f = 17.84
- Mean Elevation (meters) by Year: p = .00745, df = 1, f = 7.32

- Elevation increased at most sites between 2018 and 2019.
- Deposition from Hurricane Barry about 2 weeks before litter bag recovery in July 2019 could have played a large role.
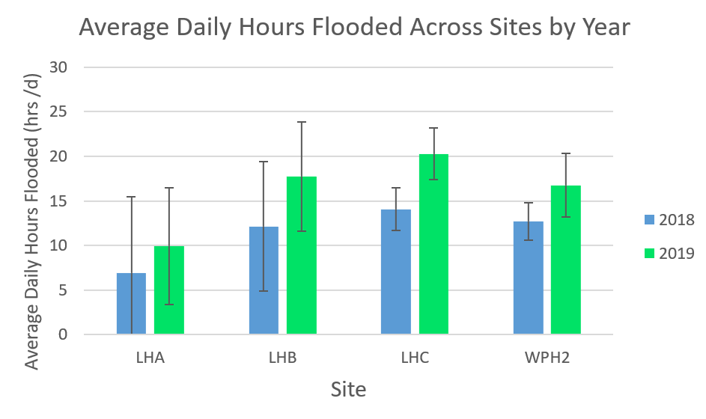
Results: Average Daily Hours Flooded Across Sites and Years
- Flooding differed across sites and between years.
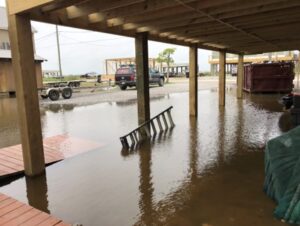
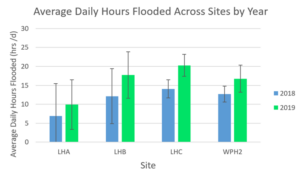
- It was lowest at LHA but increased across all sites in 2019 due to higher water levels and increased storm events and/or wind.
- Average Daily Hours Flooded by Site: p < 0.001, df = 3, f = 21.52
- Average Daily Hours Flooded by Year: p < 0.001, df = 1, f = 32.95
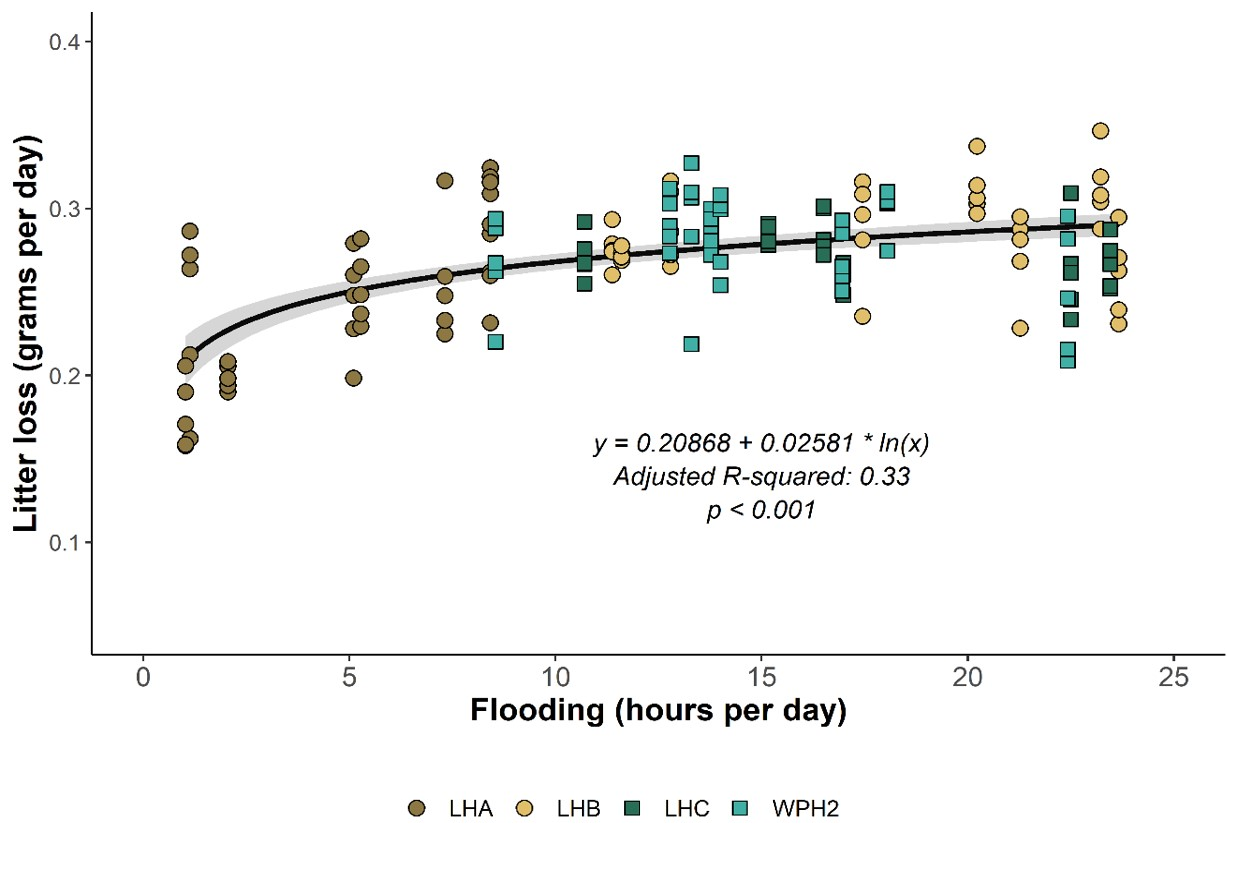
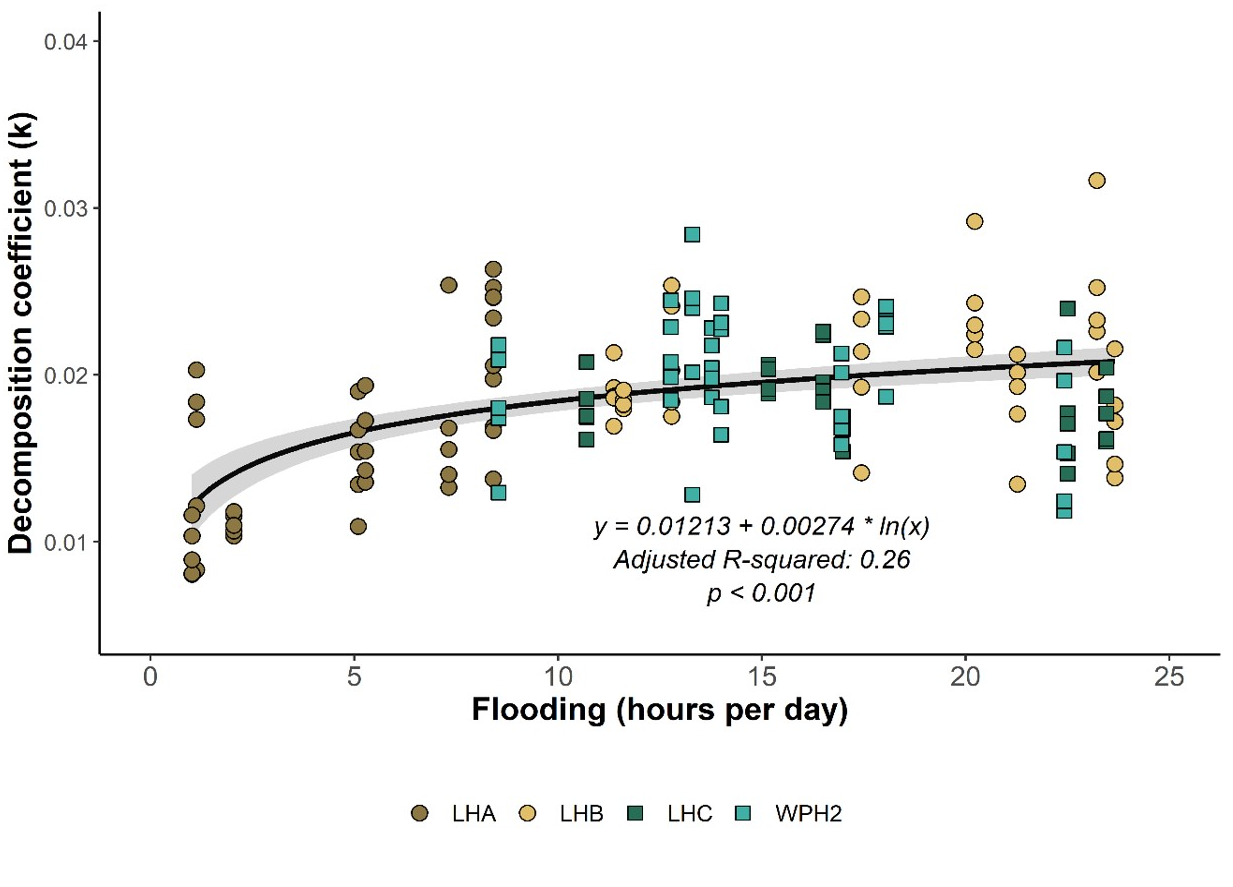
Results: Impacts of Flooding on Litter Loss
- As average daily hours flooded increases, litter loss and decomposition coefficients also increase across sites.
- Logarithmic relationships were better predictors of decomposition than linear relationships.

Implications
- Created sites (e.g. LHB) and natural sites with similar elevation and inundation have comparable litter decomposition dynamics.
Microbial Community
(Engel)
Key Findings
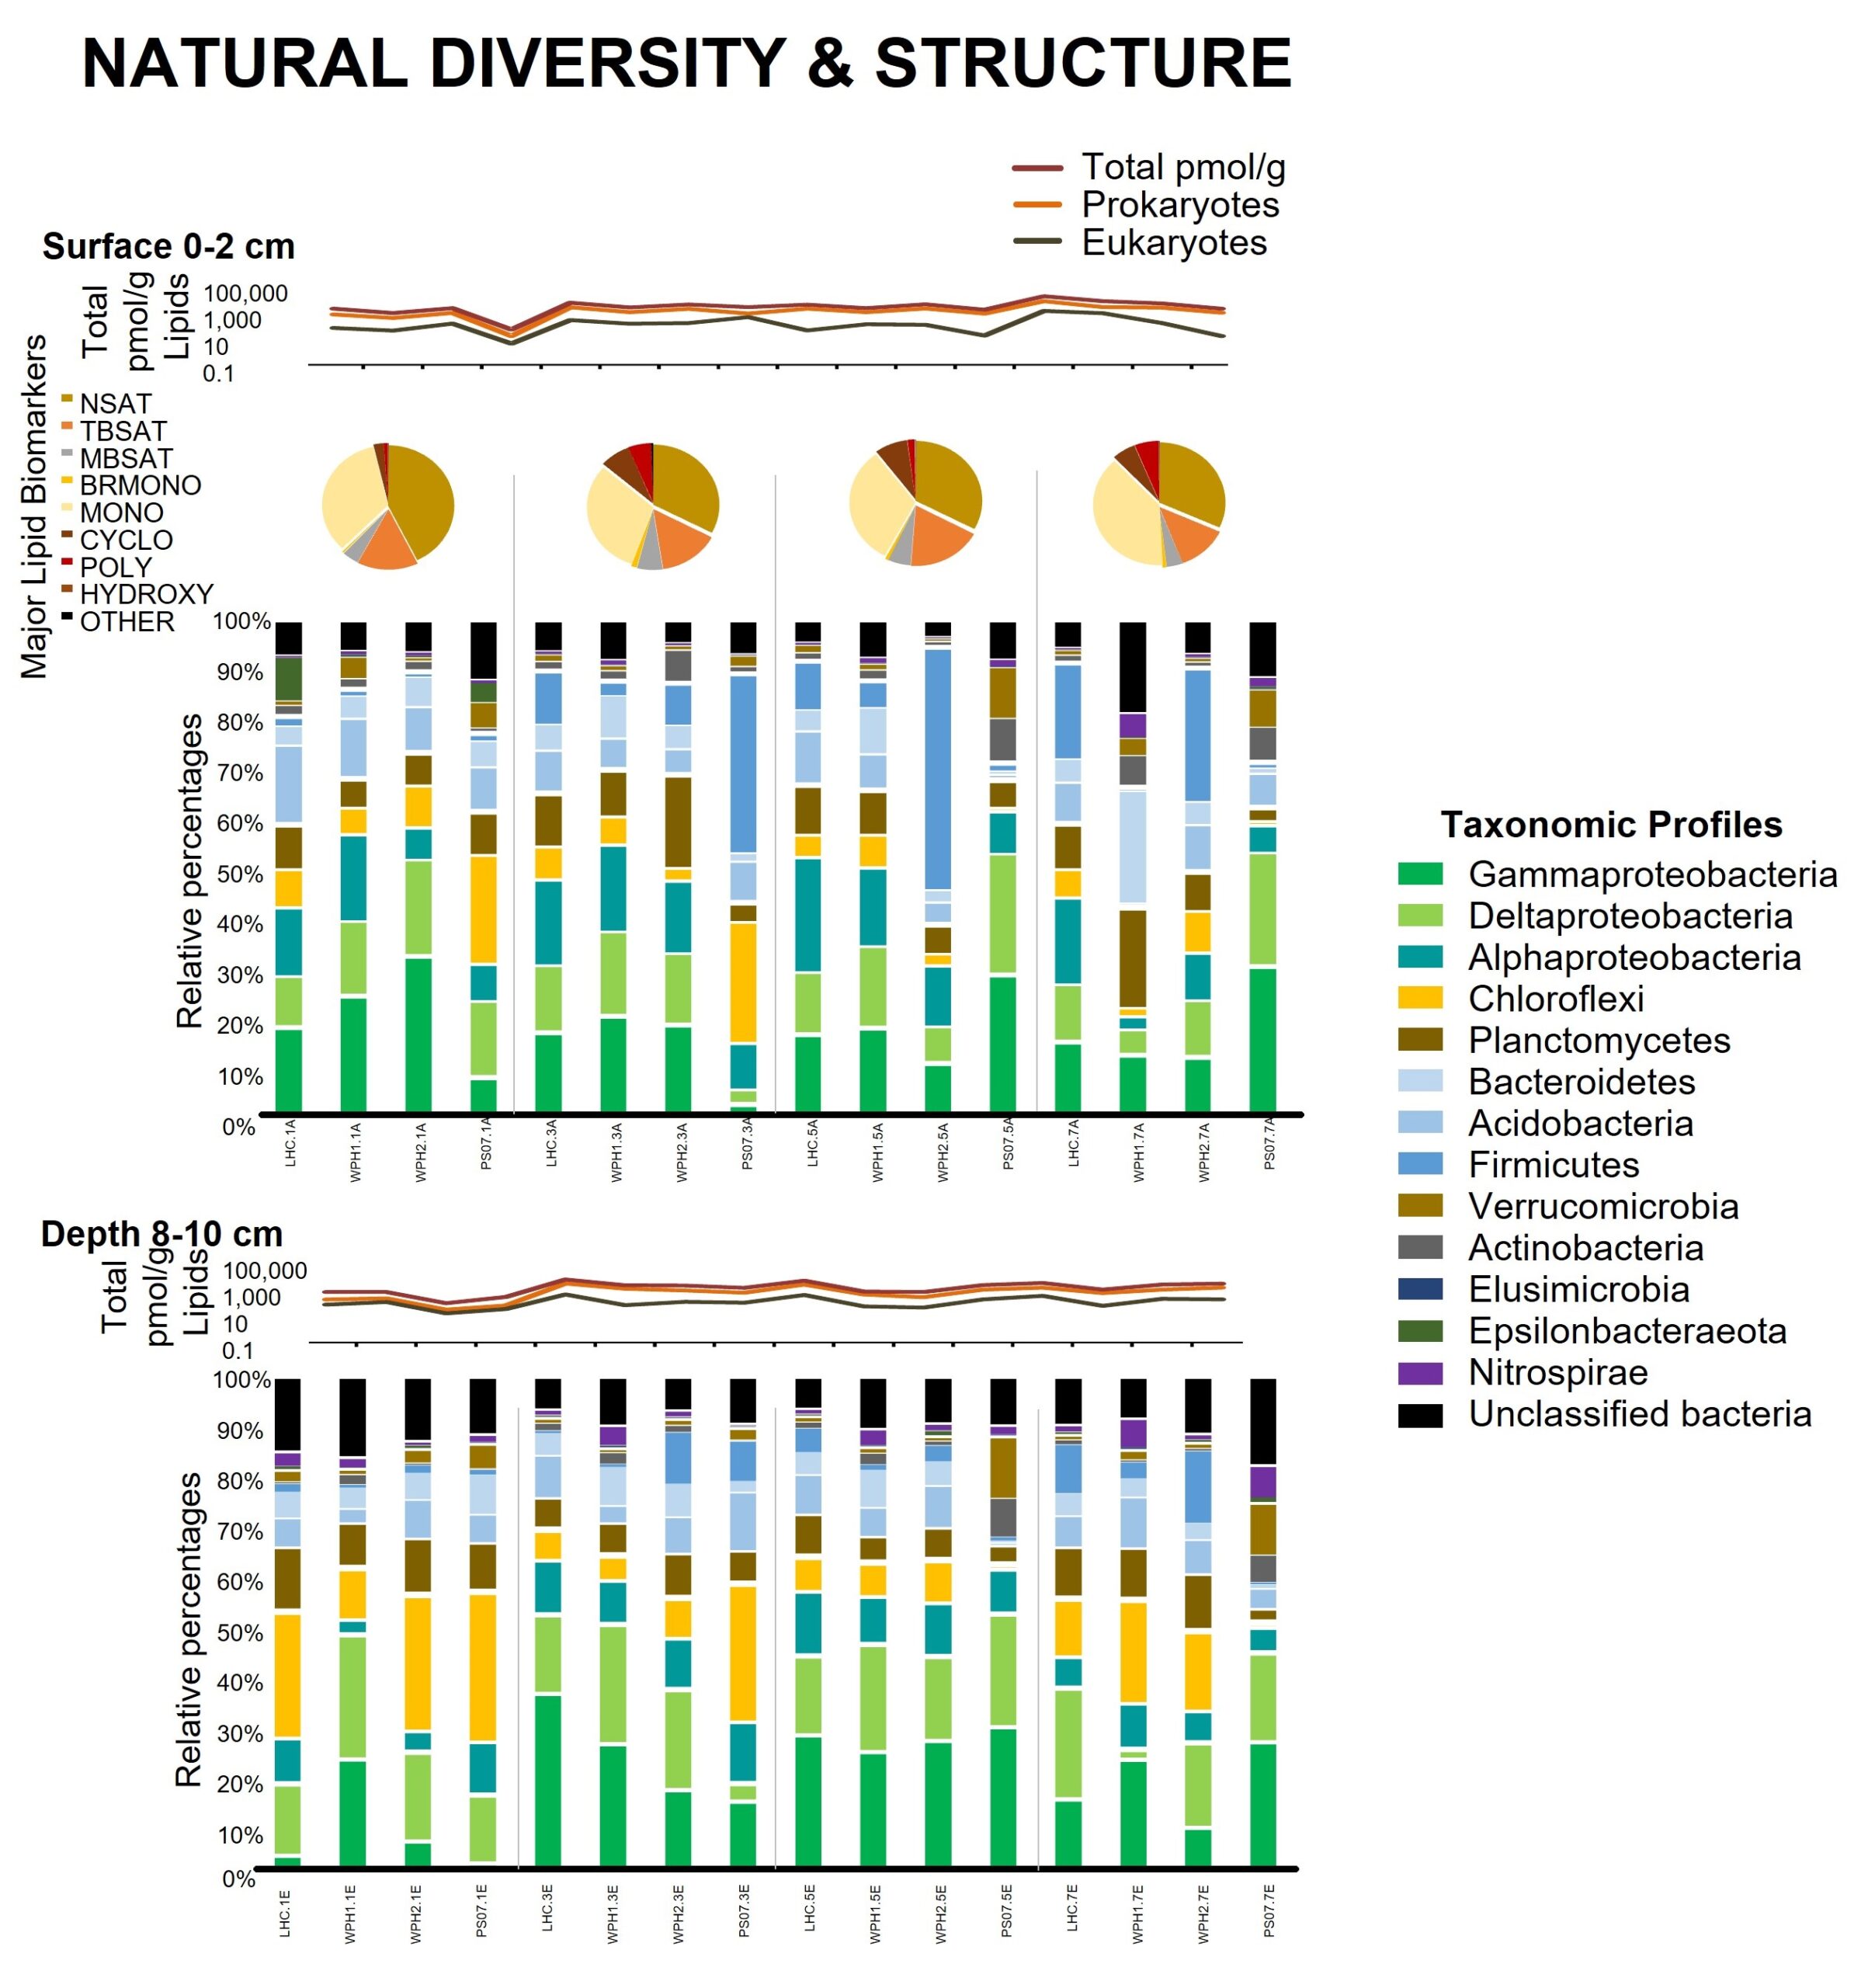
- Created marsh soils are fundamentally different than natural soils: lack well-developed peatlayer, wider grain size distributions (and larger overall particle sizes), less organic carbon.
- Distinct microbial communities within soils, which affect the types of metabolic processes and microbial community services that influence the marsh habitat through time.
- Overall taxonomic diversity similar, but specific genetic groups differed between created & natural marshes

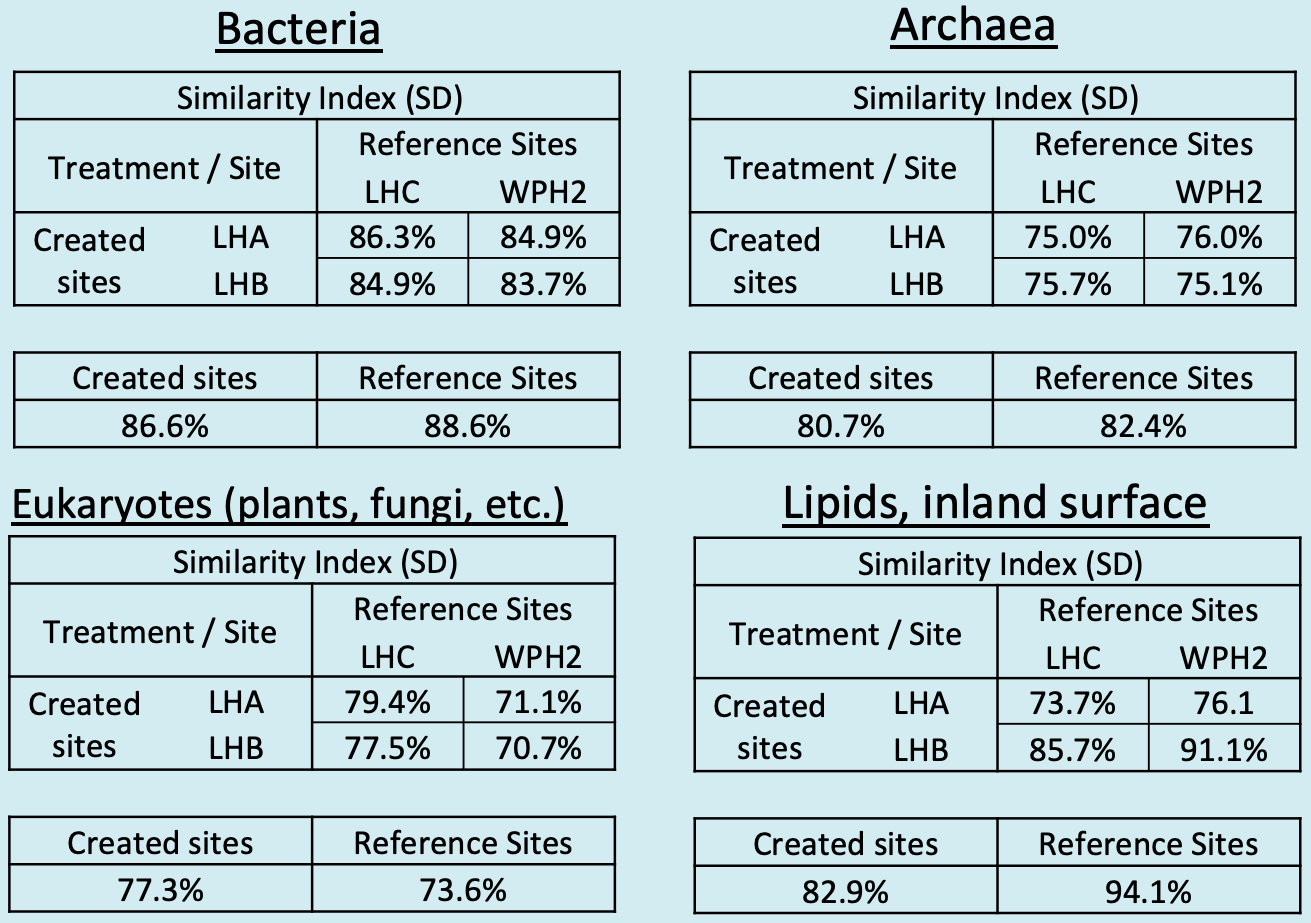
Key Findings
- Similar diversity (H’) between created and reference sites with some exceptions.
- Operational taxonomic units (genetic units) used for comparisons
- High community similarity across all sites.
- LHA & LHB Bacteria & Archaea are slightly more like each other than reference sites.
Key Findings
- Aboveground plant biomass for the natural marshes was predominately Spartina alterniflora, with other marsh plant species like Spartina patens and Disticlus spicata.
- Restored marshes had less traditional marsh vegetation, despite efforts to plant and grow them on the newly constructed marsh platforms.
- The elevation of the restored marshes likely affects whether or not S. alterniflora is successful, as S. alterniflora dominates the plant community near the shoreline.
- Membrane lipid results from all natural and all restored marshes, separated by soil depth (0-2 cm and 8-10 cm depth).
- 16S rRNA gene sequence results for major bacterial phyla from all natural and all restored marshes, separated by soil depth (0-2 cm and 8-10 cm depth).
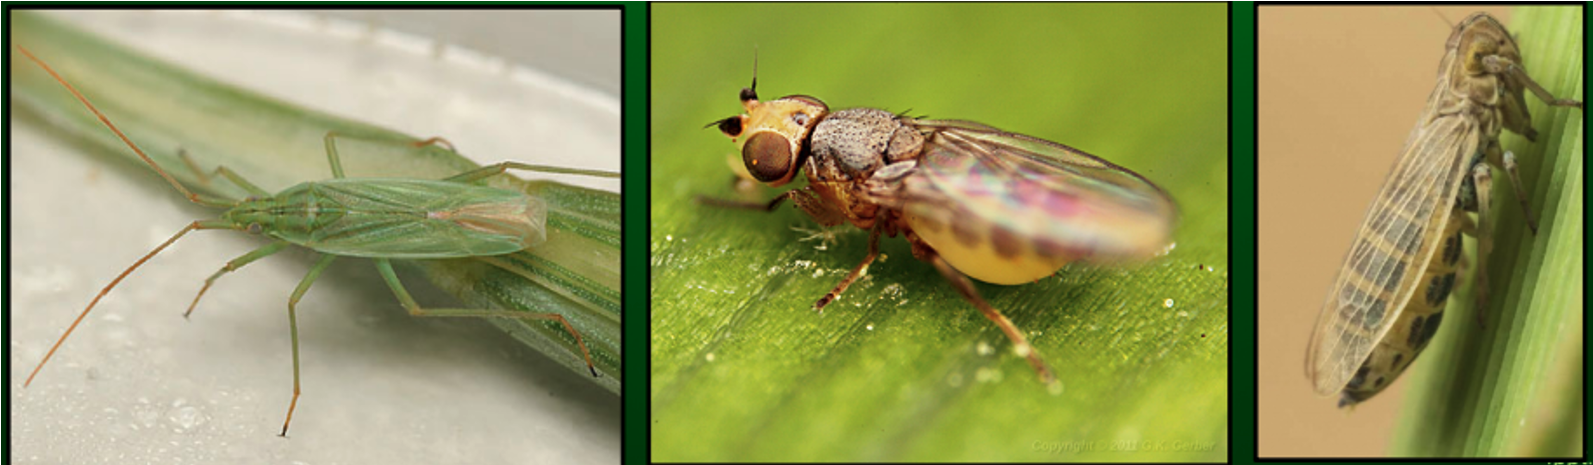
Insects and Spiders
(Hooper-Bùi)
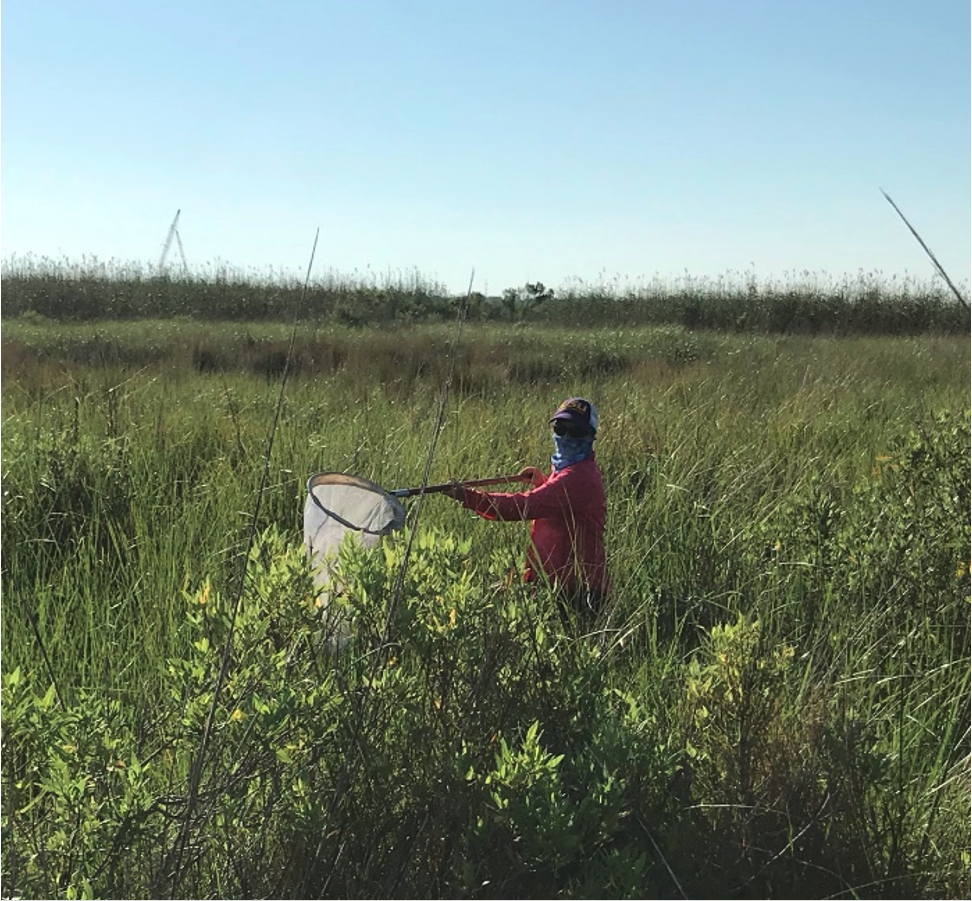
Field Work: May 2019
- Emergence traps set Day 1, collected Day 8
- 4 replicate sweeps at each site for biodiversity
- 4 replicate sweeps at each site for isotopes
Key Findings
- Not all works all the time. We placed emergence traps on the marsh platform on the first day. We collected insects via sweep net for biodiversity and community metrics. Another identical sweep sample was taken 5 m away for the insects for isotopes.
- This is the second year (2019) we set the emergence traps. Last year (2018), there were a few insects – flies – in the emergence traps but not enough for isotope analyses. There were no insects in the emergence traps this year, likely because May may be too early in the year. One trap blew into the water on day 3 and was retrieved by the fish group. We added asecond collection of sweeping for isotopes to make up for the low numbers of insects in the emergence traps.


Key Findings
Species Diversity (H’)
- Higher richness (78 morpho-species) in LHA and LHB (66) at LHB relative to reference sites (LHC: 50; WPH2: 48)
Community Similarity (SD)
- ~52-64% community similarity between all sites

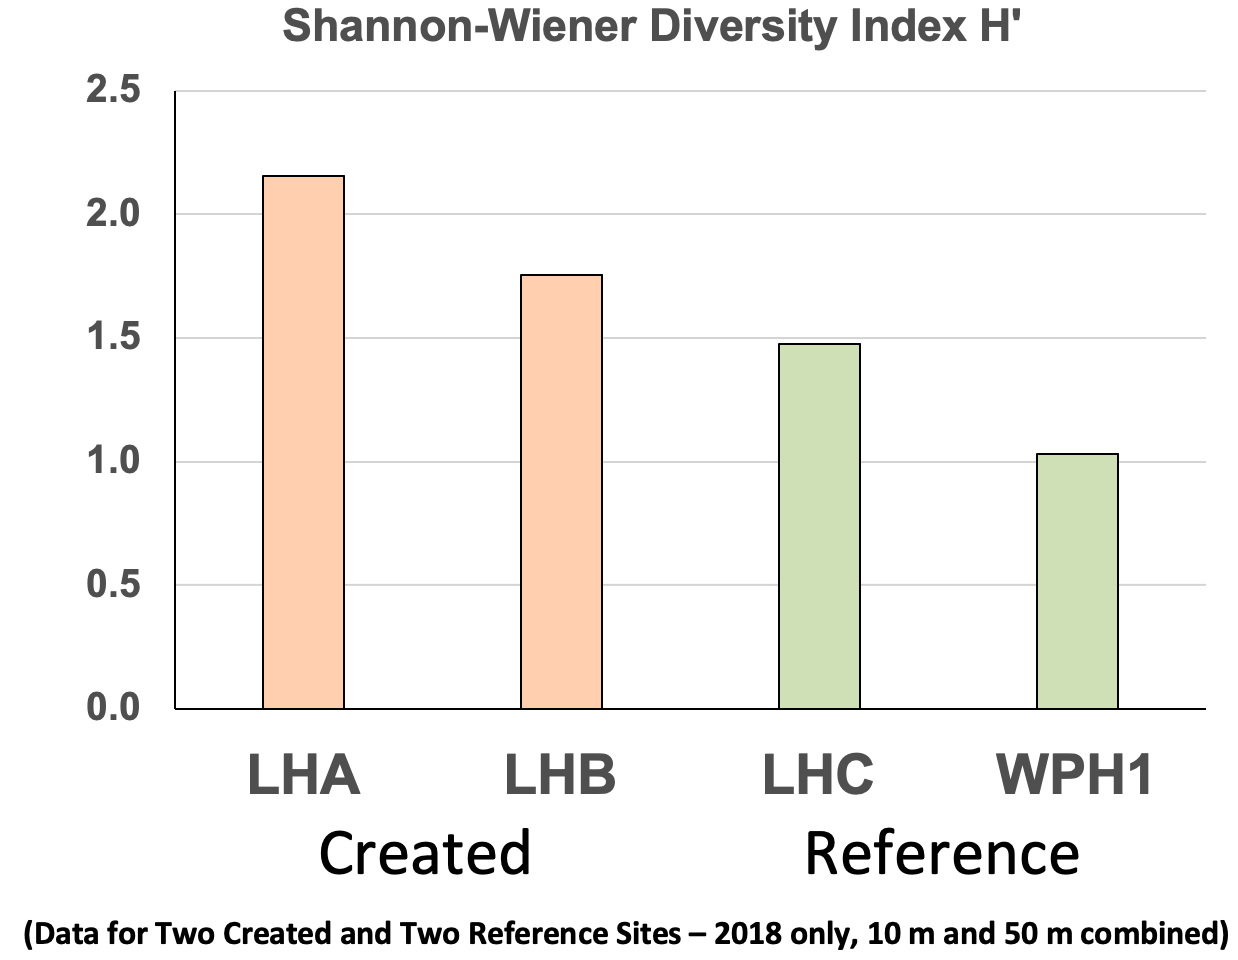
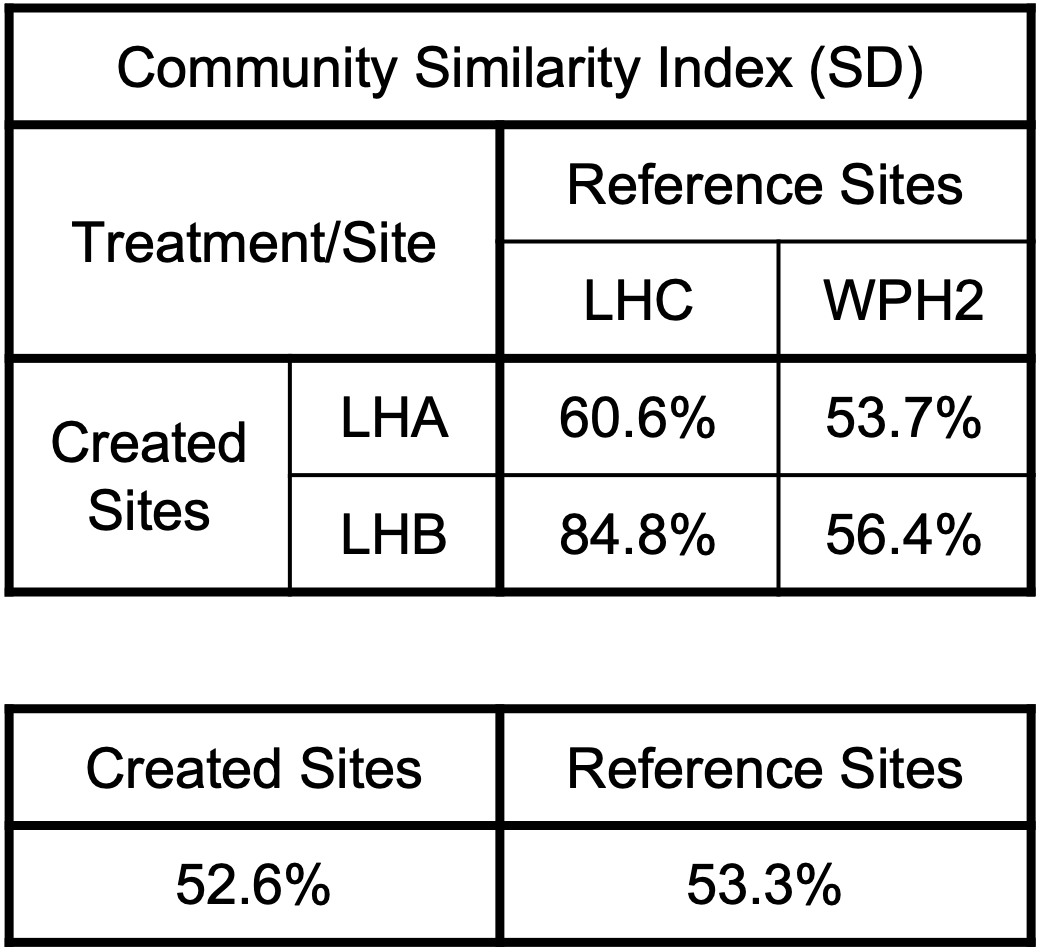
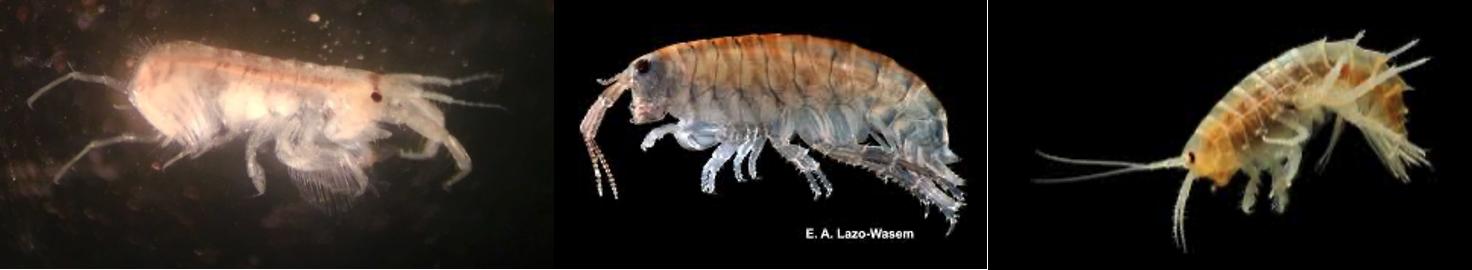
Benthic Infauna
(Rabalais)
Field Work: May 2018 and May 2019
- 1 transect per site (middle), 2 distances from edge (10 m, 50 m)
- 5 replicates infauna, TOC, grain size


Key Findings
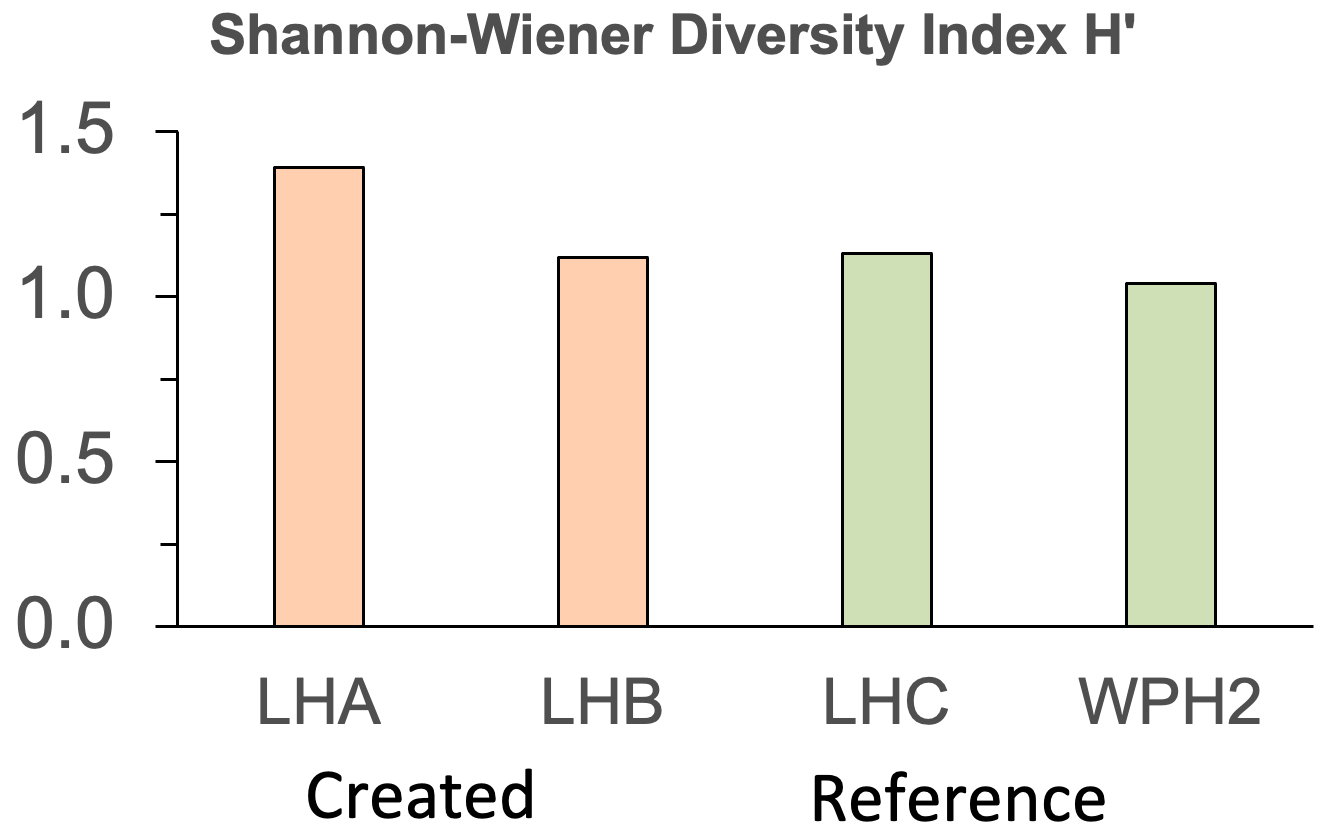
- Higher diversity (H’) in created marshes
- ~50-60% community similarity between all sites, apart from LHB and LHC (~84.8%)
Trawl and Suction Sampling
(Martin)
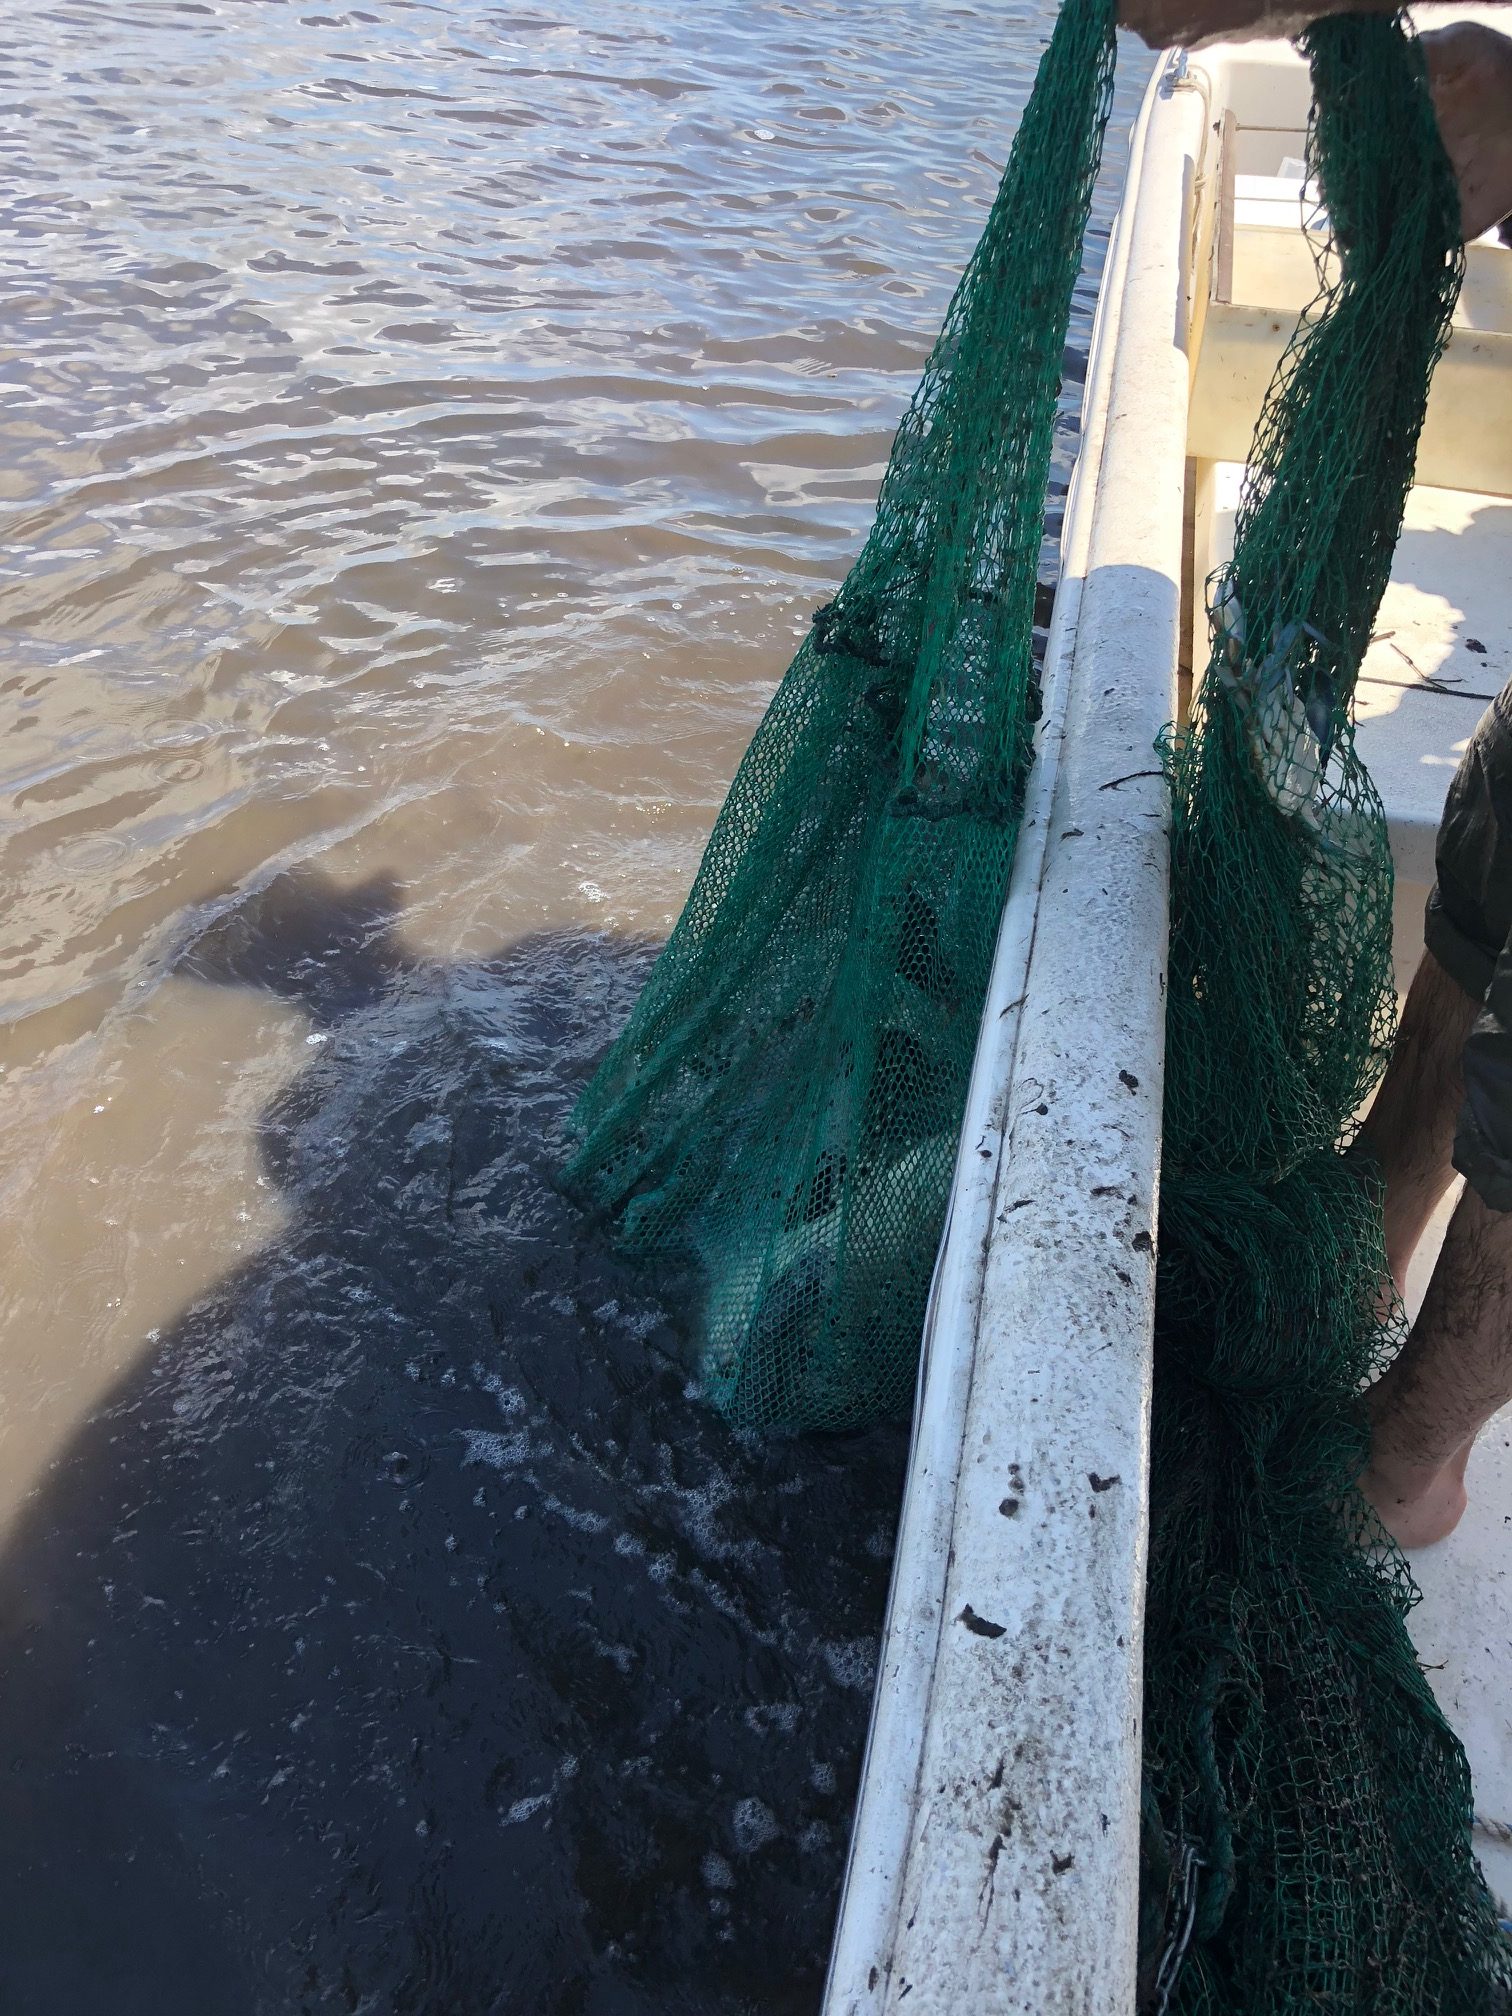
Field Work: May 2018 and May and July 2019
- 8 trawls/site in years 1 and 2
- Year 1 suction, n = 10 at salinity gradient sites
- Year 2 suction, n = 9/site
Key Findings
- Trawl: Clear differences between years, sites
- Nekton community varies among sub-habitats (ANOSIM, Global R=0.333 , p=0.001). Biodiversity is highest in ponds at natural marshes.
- We identified a need to incorporate site-specific data (e.g., pond sizes, marsh height) to determine which drivers influence community structure in ponds, creeks, or edges, across sites


Key Findings
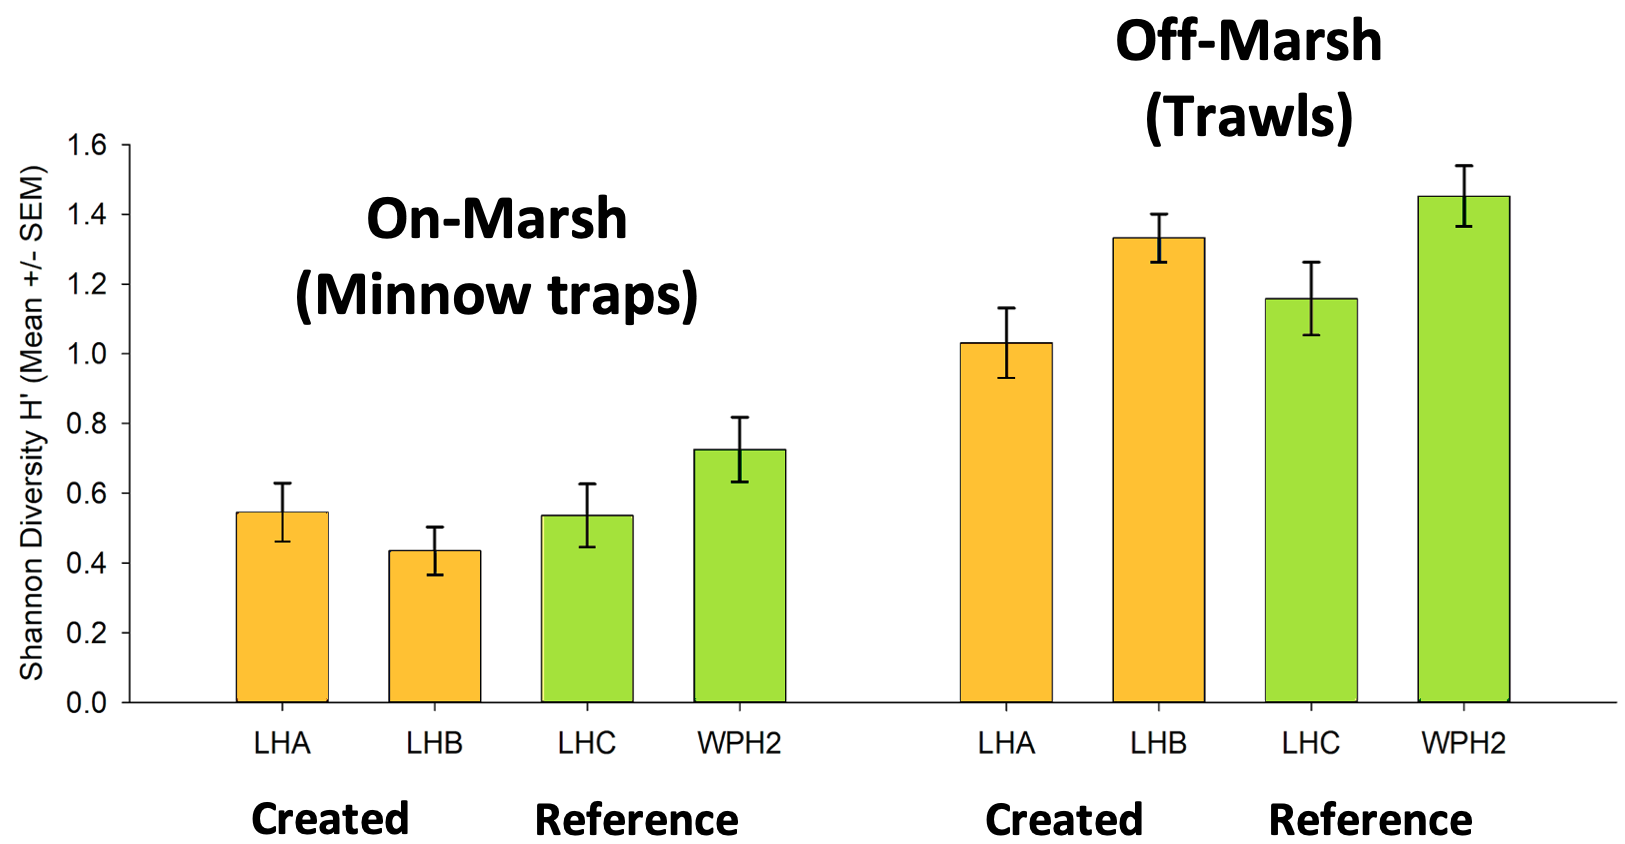 Species Diversity (H’)
- No differences in diversity between the created & reference sites for both “on-marsh” & “off marsh” nekton communities
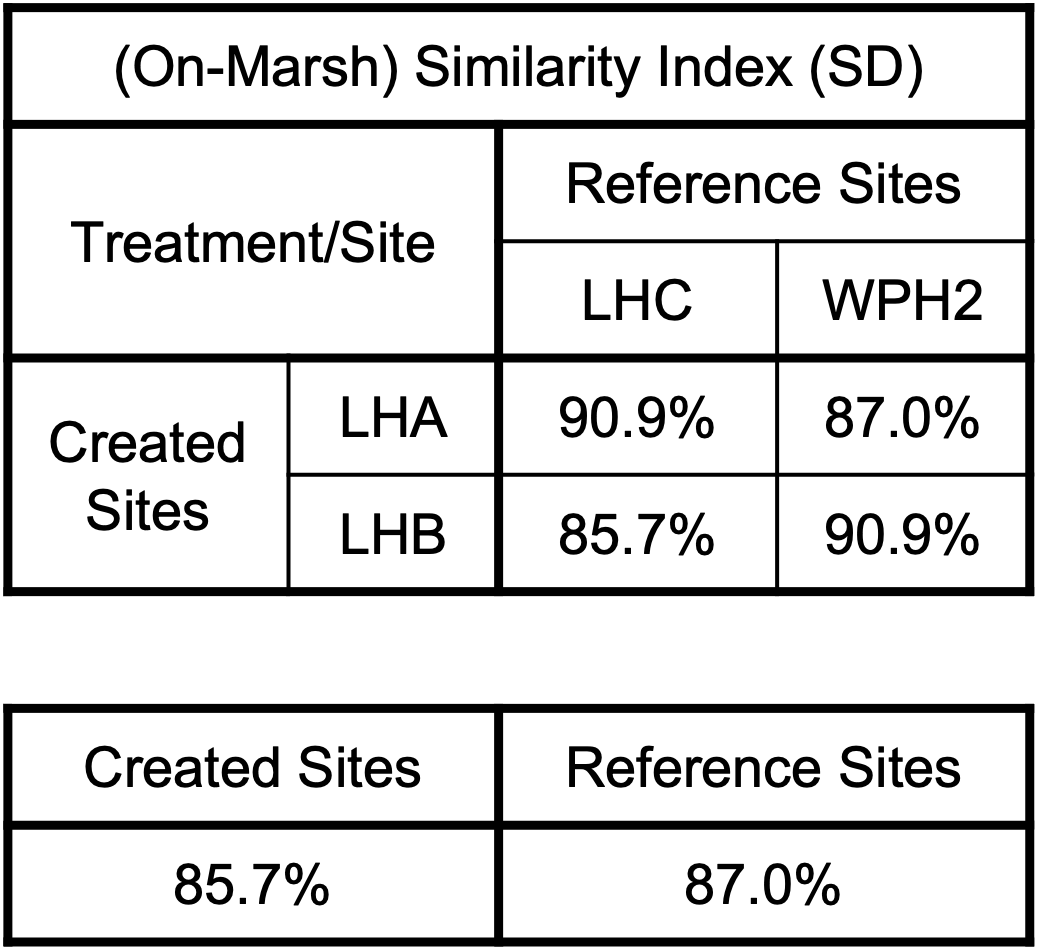
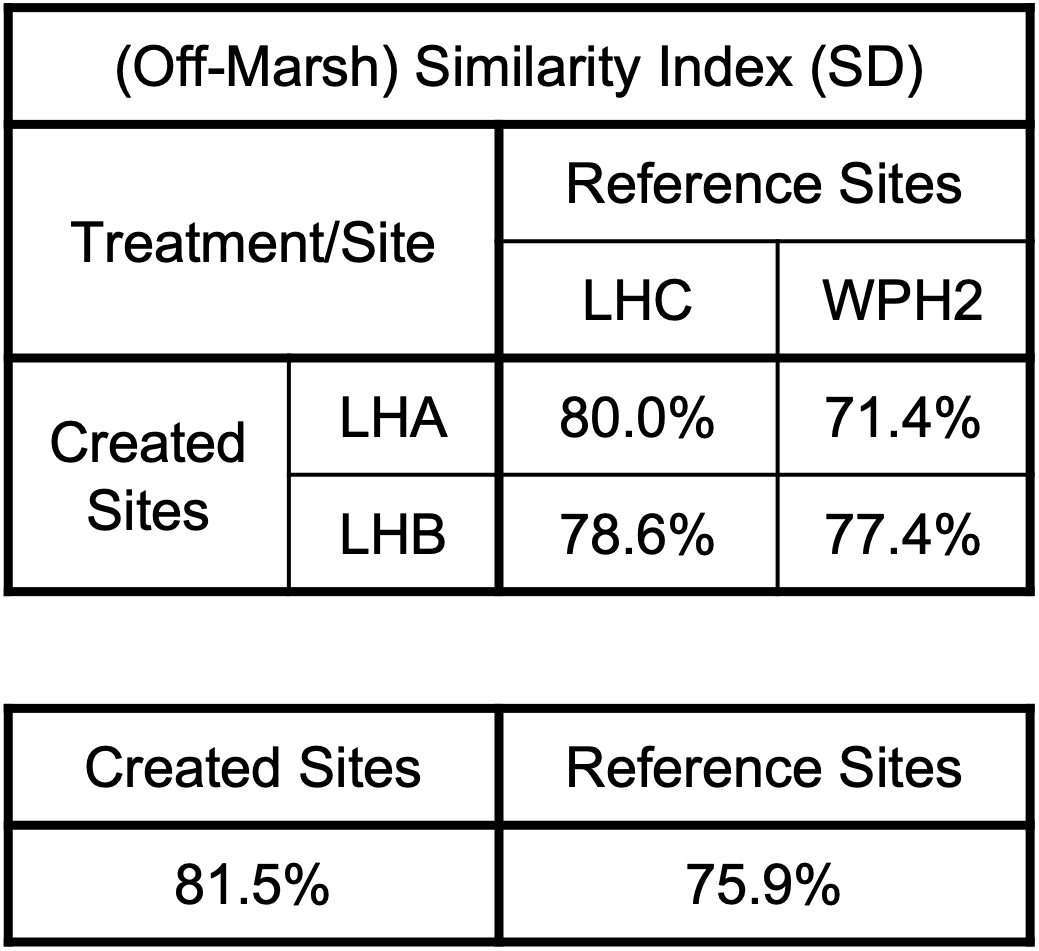
Community Similarity (SD)
- High similarity across sites (~71-90%)
- Nekton communities at created marshes are equally similar to communities at reference marsh as they are to each other.
Biomarkers
(Polito, Olin, Lopéz-Duarte)
Field Work: May 2019
- Collected ~2000+ sample in 2018 & 2019
- Fish, invert, plants, submerged aquatic vegetation, algae, benthic microalgae, soil organic matter, particulate organic matter
Lab Work
- Processed 1800+ samples from 2018
- C&N isotopes: 2016 & 2018 complete
- Compound-specific: 2016 complete
- Heads collected for otoliths
Key Findings
- Aquatic basal carbon sources are more important than terrestrial at all sites.
- Similar trophic level but slightly higher use of terrestrial carbon at natural sites relative to created sites.


Key Findings
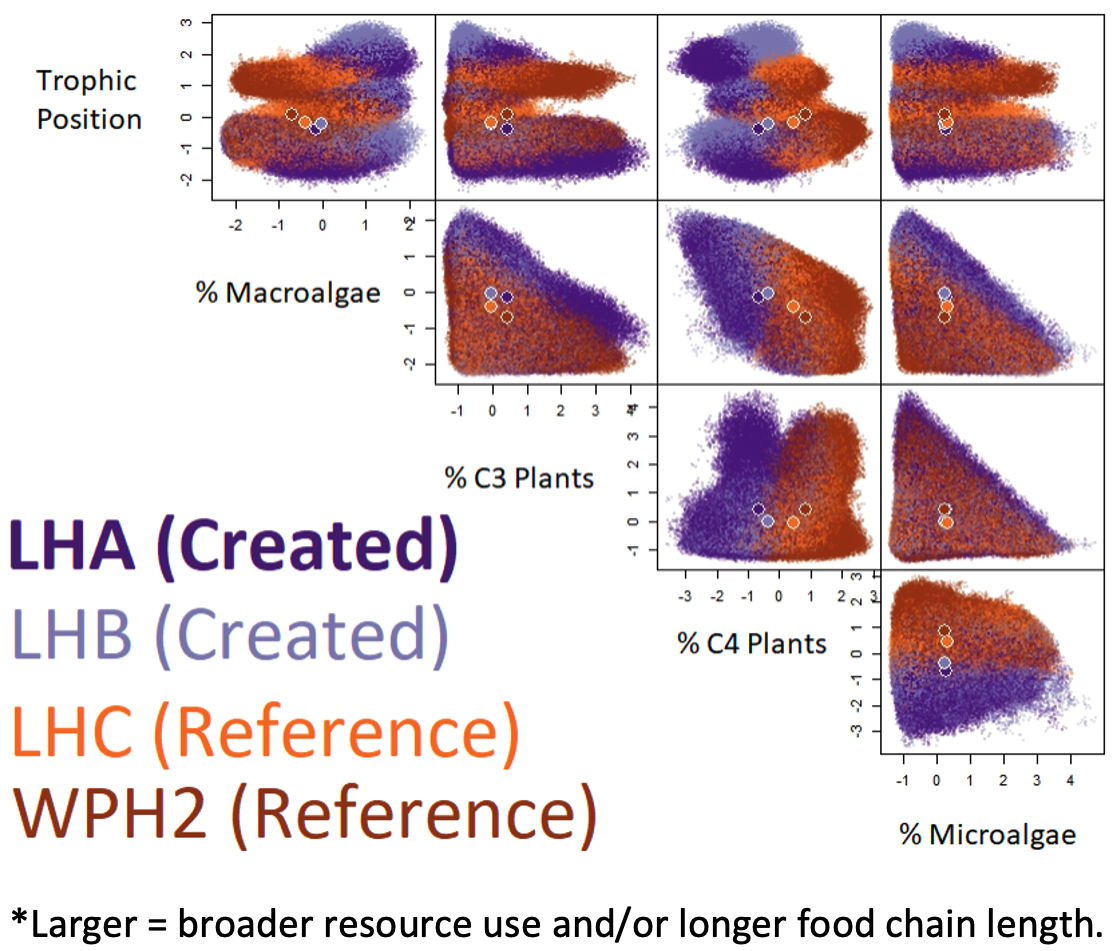
Trophic Hypervolume Size
- Reference sites (LHC & WPH2) have the smallest (24.1 & 26.1), LHA the largest (59.9) , and LHB is intermediate (30.6)
Food-Web Similarity (SD)
- LHA is least similar to reference sites (18-33%)
- LHB is nearly as similar to reference sites as created sites are to each other.
- Created sites: wider trophic niches
- Created sites: lower C4 plant contribution
